Germany recycles the most of its household and municipal waste of any country with comparable official data: 69% in 2024, according to Eurostat, ahead of Slovenia, Austria and the Netherlands. Measured in kilograms recycled per person, Austria and Germany lead. The countries that produce the most waste per person are rich ones, led by the US, Canada and the Gulf states.
The infographic by Paper Boss, an Australian packaging company, ranks 164 countries by waste generated per person and shows the recycling share for the 68 where it was available, using data from the Waste Atlas. Its figures are undated and older than the official numbers now published, and several recycling rates have moved a long way since. This article uses the latest official figures, from Eurostat, the US Environmental Protection Agency (EPA), Singapore’s National Environment Agency and the World Bank.
Which country recycles the most waste?
Germany has the highest municipal waste recycling rate in Europe, at 69.0% in 2024, and it has been top of Eurostat’s table for years [1]. The rate counts material recycling plus composting and digestion of food and garden waste, as a share of all municipal waste.
| Country | Municipal waste recycled, 2024 |
|---|---|
| Germany | 69.0% |
| Slovenia | 62.4% |
| Austria | 60.7% |
| Netherlands | 58.0% |
| Belgium | 56.6% |
| Luxembourg | 56.5% |
| Latvia | 52.7% |
| Lithuania | 52.5% |
| Italy | 52.3% |
| Switzerland | 51.8% |
| EU average | 49.4% |
Source, Eurostat recycling rate of municipal waste (cei_wm011), EU and EFTA countries [1].
The Paper Boss graphic also puts Germany first, but with a much lower share, 47%, and gives Slovenia 55%. Those were older Waste Atlas figures; Germany’s official rate has been above 65% throughout the 2020s [1][2].
The lowest rates in Europe are in the Balkans and the south east. Within the EU, Romania (12.4% in 2023), Cyprus (15.8%), Malta (16.9%) and Greece (17.5%) recycle the least [1].
Which countries recycle the most per person?
Austria recycles the most waste per person in Europe, 471 kg in 2024, followed by Germany at 425 kg. This measure rewards countries that both produce a lot of waste and recycle a high share of it [3].
| Country | Waste generated per person, 2024 | Recycled or composted per person |
|---|---|---|
| Austria | 775 kg | 471 kg |
| Germany | 616 kg | 425 kg |
| Luxembourg | 730 kg | 412 kg |
| Belgium | 699 kg | 396 kg |
| Denmark | 758 kg | 350 kg |
| Switzerland | 670 kg | 347 kg |
| Norway | 721 kg | 338 kg |
| Slovenia | 526 kg | 328 kg |
| EU average | 513 kg | 253 kg |
Source, Eurostat municipal waste by waste management operations (env_wasmun) [3].
The Paper Boss chart, which uses the same kind of measure, has Germany first at 290 kg recycled per person and Singapore second at 286 kg. On current Eurostat data, Germany recycles about 425 kg per person a year [2][3].
Recycling outside Europe
Outside Europe, national figures are measured in different ways, so they are hard to compare directly with Eurostat’s. The two most often quoted examples are the United States and Singapore.
The US EPA’s most recent national figures, for 2018, show 292.4 million tons of municipal solid waste, or 4.9 pounds per person a day (about 810 kg a year, our conversion). About 69 million tons were recycled and 25 million tons composted, a combined rate of 32.1%, while 50% went to landfill [4]. The Paper Boss graphic gives the US 734 kg per person and a recycling share of 23.8%, which matches the EPA’s recycling figure alone, without composting [2][4].
Singapore’s overall recycling rate was 52% in 2025, according to its National Environment Agency, but that figure is dominated by business and construction waste: the non-domestic rate was 67%, and households recycled only 11% [5]. The graphic’s 59% for Singapore is an older overall figure, so it says little about what households recycle [2][5].
Which country produces the most waste per person?
Rich countries produce the most waste per person. The World Bank’s What a Waste 3.0 report found that North America generated 2.25 kg of waste per person a day in 2022, the highest of any region, against a global average of 0.88 kg and about 0.5 kg in Sub-Saharan Africa and South Asia [6]. The US and Canada are both at 2.2 kg a day or more, Germany at 1.63 kg and China at 0.97 kg [6].
The Paper Boss ranking puts Bahrain first at 907 kg per person a year, followed by Comoros (813 kg), Canada (777 kg), Denmark (747 kg) and the United States (734 kg), with Ethiopia and Kenya lowest at 110 kg each [2]. It still lists North Macedonia under its former name, FYROM, which the country dropped in 2019. Comoros, a small island nation, looks out of place among the high-income countries at the top, and the figure could not be checked against a current official source. In Europe, Eurostat’s 2024 figures put Austria (775 kg), Denmark (758 kg) and Luxembourg (730 kg) highest, and Estonia (375 kg) and Poland (387 kg) among the lowest [3].
How much waste the world produces
The world produced 2.56 billion tonnes of municipal solid waste in 2022, according to the World Bank, a level its 2018 report had not expected until 2030 [6]. Under business as usual it projects 3.86 billion tonnes a year by 2050, an increase of 50% [6].
Most of it is not recycled. Globally, 29% of waste goes to landfill, 21% is recycled, composted or anaerobically digested, 20% is incinerated, and almost a third is either openly dumped or not collected at all, the World Bank says [6]. In total tonnes, the East Asia and Pacific region produces the most, 849 million tonnes in 2022 [6].
Why some countries recycle more than others
Law and targets are a large part of it. EU countries have had to recycle at least 50% of municipal waste since 2020 and 55% from 2025, and Eurostat reports that in 2023 Austria, Luxembourg and Belgium had already passed 55% under the stricter new calculation rules [7]. Eurostat also notes that the amount of waste each country produces reflects consumption and wealth, and how municipal waste is collected and managed [7].
Landfill rates show the other side of the same policies. In 2024 Switzerland and Belgium sent almost none of their municipal waste to landfill, and Germany and Sweden less than 1% (our calculation from Eurostat data) [3]. Since they recycle 50% to 69% and landfill almost nothing, most of the rest is incinerated, usually to produce energy.
How the rate is measured matters as much as what happens to the waste. Eurostat notes that countries could until recently use “old rules” that counted only some materials, such as paper, metal, plastic and glass, which flattered some rates; from 2025 every EU country must measure recycling at the point the waste enters a recycling plant [7]. That is one reason figures like those on the Paper Boss graphic, gathered from different national sources in different years, can differ so much from current ones.
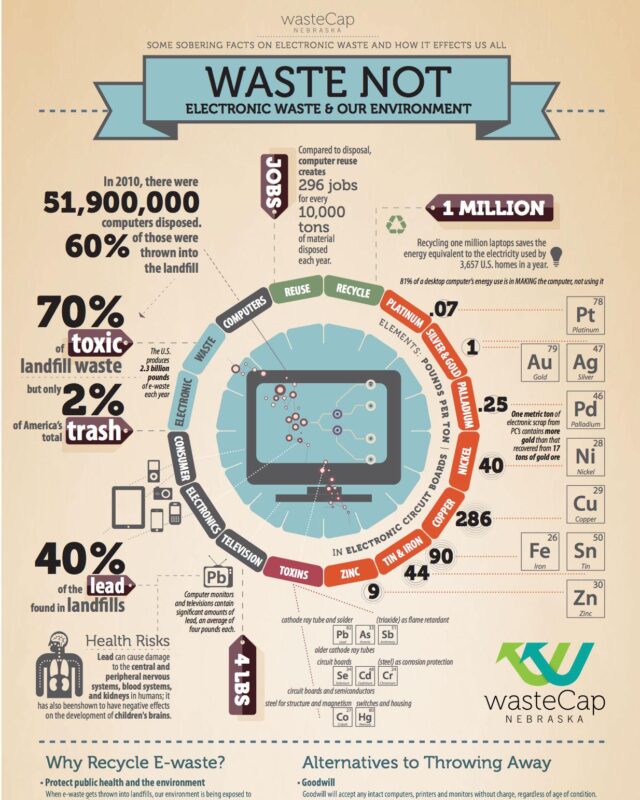
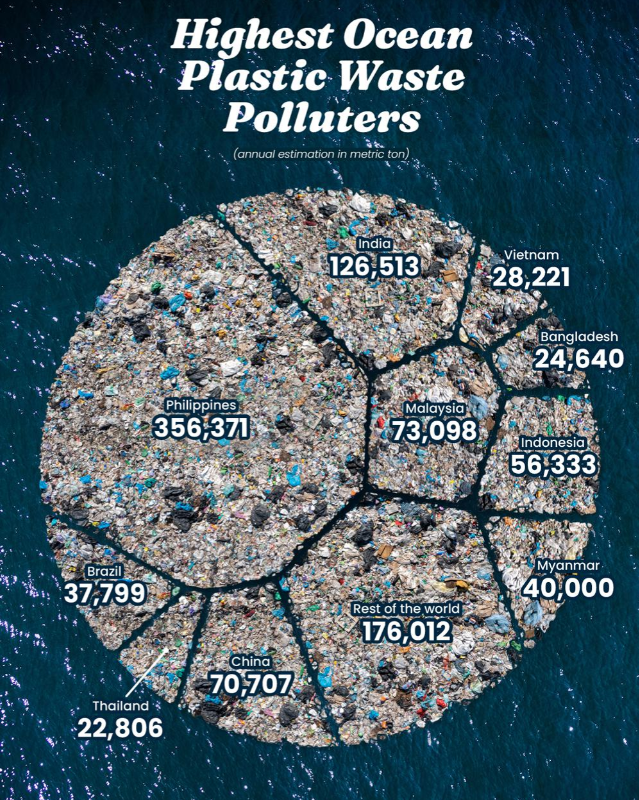
For other kinds of waste, see our pages on electronic waste recycling statistics and the countries that put the most plastic in the ocean.
Questions about which country recycles the most
What is the recycling rate in Germany?
69.0% of municipal waste in 2024, the highest in Europe, according to Eurostat. That includes composting and digestion of organic waste [1].
Which country only sends 1% of its waste to landfill?
Several do. In 2024 Switzerland, Belgium, Finland, Germany and Sweden all sent less than 1% of their municipal waste to landfill, according to Eurostat data (our calculation). Most of the rest is recycled or burned to produce energy [3].
Does the US recycle much?
Less than most of Western Europe. The EPA’s latest national figures put the US recycling and composting rate at 32.1% in 2018, with half of all municipal waste landfilled [4].
Which country recycles the least?
Among countries with official data, rates are lowest in parts of the Balkans: Eurostat records about 1% for Bosnia and Herzegovina and under 4% for Montenegro in 2024 [1]. Many lower income countries do not report a formal recycling rate at all, and the World Bank notes that informal workers play a critical role in collecting, sorting and recycling waste there [6].
Sources
- Eurostat, Recycling rate of municipal waste (cei_wm011), accessed November 2026.
- Paper Boss, Which Countries Produce the Most Waste and Which Countries Recycle the Most?, data from the Waste Atlas.
- Eurostat, Municipal waste by waste management operations (env_wasmun), accessed November 2026.
- US Environmental Protection Agency, National Overview, Facts and Figures on Materials, Wastes and Recycling.
- National Environment Agency, Singapore, Waste Statistics and Overall Recycling.
- World Bank, What a Waste 3.0.
- Eurostat, Municipal waste statistics, data extracted January 2026.