Environment and Energy
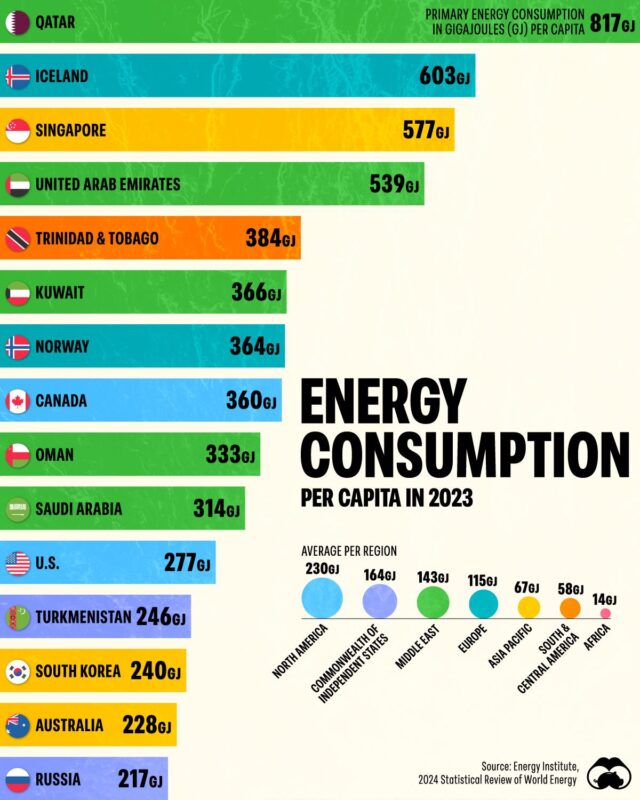
Energy Consumption per Capita by Country
The US uses about 270 GJ per person and the UK about 90 GJ, according to the Energy Institute's 2026 Statistical Review of World Energy as published by Our…
489 reviewed infographics. Search them, or narrow the list by topic or type and sort it the way you want.
The US uses about 270 GJ per person and the UK about 90 GJ, according to the Energy Institute's 2026 Statistical Review of World Energy as published by Our…

In 2023 it produced 12.9 million barrels of crude oil a day, ahead of Russia (10.6 million) and Saudi Arabia (9.6 million), out of a world total of about…

In 2024 China bought 4,057 million barrels of crude, about 11.1 million barrels a day, and Russia supplied 803 million barrels, 19.8% of the total.

The reading is disputed, and a 2025 study argues it was far too high.
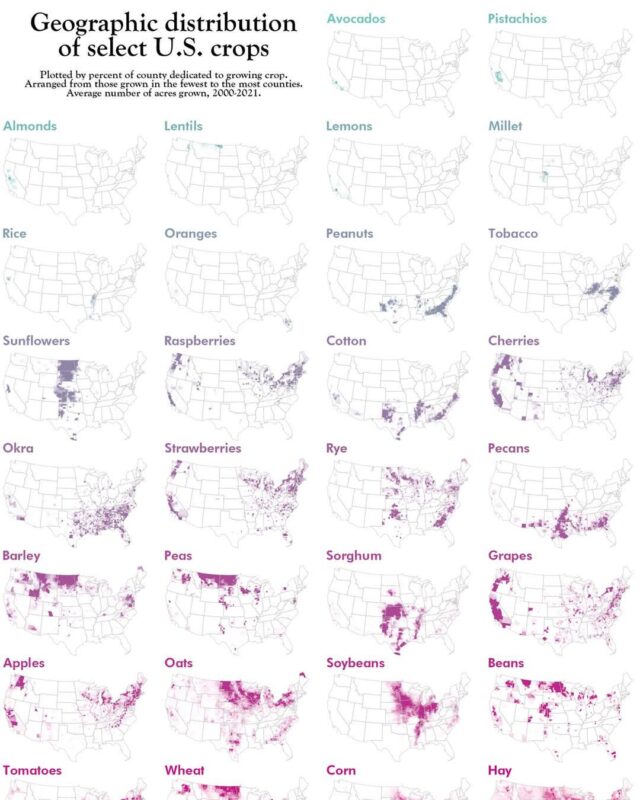
In 2025 corn covered 91.3 million harvested acres, more than any other crop.

The United States is second at 5.0 billion tonnes and India third at 3.2 billion.

Air rises and drops heavy rain near the equator, sinks and keeps the subtropics dry around 30 degrees north and south, and rises again in the stormy…

Energy Information Administration figures, followed by Saudi Arabia with 267 billion and Iran with 209 billion.

Africa is close behind, while Europe and North America show smaller falls, partly because much of their wildlife was lost before 1970.

Global natural gas production was about 392.7 billion cubic feet a day in 2023, roughly 4,060 billion cubic metres a year, and reached 4.34 trillion cubic…
Every topic page starts with a short guide to the subject.