Key points
- China imported 4,057 million barrels of crude oil in 2024, according to the map. Spread over the year that is about 11.1 million barrels a day, the figure Econovis gives in its text [1].
- Russia was the largest supplier with 803 million barrels, 19.8% of the total. Saudi Arabia was second with 568 million.
- The top 10 suppliers sent 3,549 million barrels between them, 87.5% of all imports.
- Malaysia rose from 402 to 507 million barrels, the biggest increase of any supplier. The map notes that Malaysia is not a significant oil producer, and Econovis says Iranian oil is likely being declared as Malaysian [1].
- Kuwait fell furthest, from 180 to 114 million barrels.
Text version of the map
The graphic is titled China’s Crude Oil Import Sources in 2024. Its introduction reads: China’s crude oil imports have surged from 1.4 million barrels per day (bpd) in 2000 to an unprecedented 11.1 million bpd in 2024, solidifying its position as the world’s largest importer with a 23% share of global imports in 2023. GCC countries, Iraq, and Iran collectively supplied over half of these imports, while Russia, a key supplier, accounted for 20% in 2024.
A bar chart headed Top 10 Crude Oil Exporters to China compares 2024 with 2023 in million barrels. A world map below shades every supplier by volume on a scale from 1 to 1,000 million barrels and labels China with a total of 4,057. A circle over the Gulf is captioned “Source of more than half of China oil imports”. A note beside Malaysia reads: “Malaysia is not a significant oil producer or exporter; it’s likely that Iran’s oil is being declared as Malaysian.” The footer gives the source as China’s customs and the credit as research and visualisation by Ehsan Soltani, econovis.net.
China oil imports by country, top 10
Volumes and the 2023 comparison are from the graphic. The share and daily columns are our arithmetic: each 2024 value divided by the 4,057 total, and by 366 days for the leap year.
| Rank | Country | 2024 (million barrels) | 2023 (million barrels) | Change | Share of 2024 total | 2024, thousand barrels a day |
|---|---|---|---|---|---|---|
| 1 | Russia | 803 | 785 | +18 | 19.8% | 2,194 |
| 2 | Saudi Arabia | 568 | 630 | -62 | 14.0% | 1,552 |
| 3 | Malaysia | 507 | 402 | +105 | 12.5% | 1,385 |
| 4 | Iraq | 453 | 434 | +19 | 11.2% | 1,238 |
| 5 | Oman | 301 | 287 | +14 | 7.4% | 822 |
| 6 | UAE | 263 | 307 | -44 | 6.5% | 719 |
| 7 | Brazil | 262 | 277 | -15 | 6.5% | 716 |
| 8 | Angola | 205 | 220 | -15 | 5.1% | 560 |
| 9 | Kuwait | 114 | 180 | -66 | 2.8% | 311 |
| 10 | Qatar | 73 | 77 | -4 | 1.8% | 199 |
Smaller suppliers on the map
| Region | Smaller suppliers labelled on the map (million barrels, 2024) |
|---|---|
| Europe and Central Asia | Norway 18, Kazakhstan 15, UK 12 |
| Africa | Congo 47, Gabon 21, Ghana 14, Libya 13, Nigeria 9.7, Equatorial Guinea 9.2, Cameroon 9.1, Chad 8.7, Senegal 8.5 |
| Americas | United States 71, Canada 63, Colombia 54, Ecuador 38, Venezuela 9.9, Mexico 7.5 |
| Asia Pacific | Australia 4.8 |
The labelled countries outside the top 10 add up to about 433 million barrels. The remaining 75 million or so comes from countries shaded on the map without a label.
How China became the largest crude importer
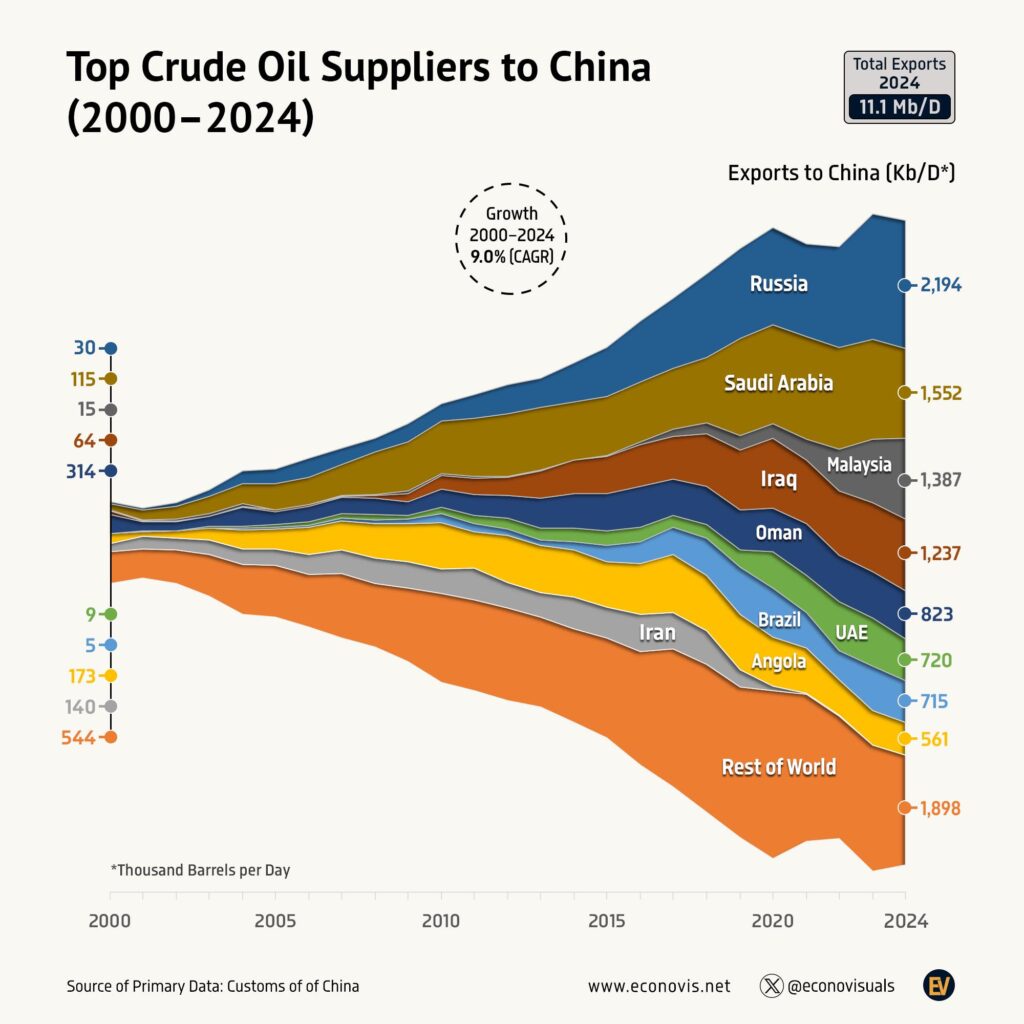
Econovis puts the growth at a compound annual rate of 9.0%, from 1.4 million barrels a day in 2000 to 11.1 million in 2024 [2]. Between 2010 and 2024 total imports grew by 6.2% a year, while imports from Russia grew by 15.1% a year, followed by the UAE at 14.7%, Iraq at 12.9%, Brazil at 11.2% and Oman at 7.0%. Imports from Saudi Arabia grew by 4.0% a year and imports from Angola fell by 2.4% a year [2].
The 2024 total was a 1.9% fall from 11.3 million barrels a day in 2023. Econovis notes that growth has levelled off: imports rose by 11.2% a year between 2002 and 2020, then by only 0.5% a year between 2020 and 2024 [3]. In 2024 Russia, Saudi Arabia, Malaysia and Iraq together supplied 57.5% of imports [4].
Why Malaysia appears on the list
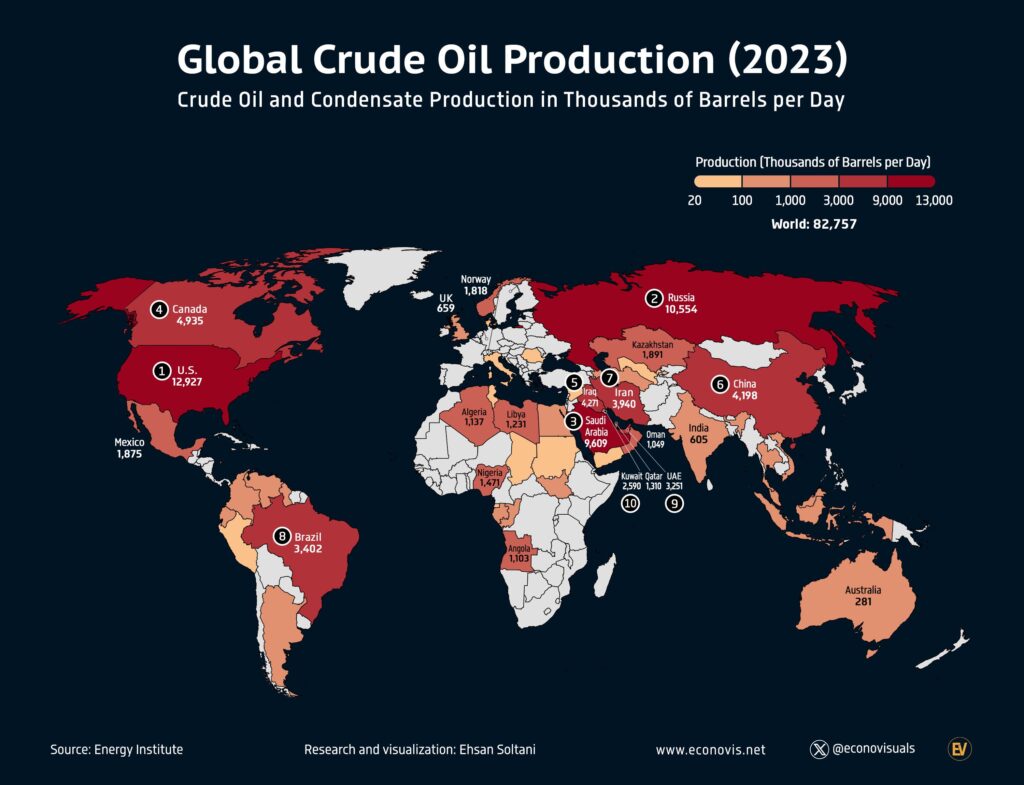
Econovis writes that Iran’s direct crude exports to China have not appeared in the data since 2020, while Malaysia became the third largest supplier [2]. Its longer analysis gives Malaysia’s own oil production as 567 thousand barrels a day in 2022 and cites Malaysian statistics showing crude exports of about 220 thousand barrels a day in 2023, with less than 5 thousand going to China [1]. Econovis reads this as China using Malaysia as an intermediary to obscure the origin of oil that likely included Iranian and possibly Venezuelan crude [1]. It also reports that China’s average 2023 import price was $86 a barrel from the Gulf Cooperation Council countries, $76 from Russia and $70 from Malaysia [1].
What has changed since 2024
The U.S. Energy Information Administration reports that China imported an annual record of 11.6 million barrels a day in 2025. Imports then fell to 8.1 million barrels a day in the second quarter of 2026, 32% less than the previous quarter, after disrupted flows through the Strait of Hormuz pushed prices up. The EIA still describes Russia as China’s top source of imports [5].
Notes on this infographic
- Units. All values are million barrels for the whole year, not barrels a day. The daily figures on this page are our conversion.
- “More than half”. The six Gulf suppliers labelled on the map (Saudi Arabia, Iraq, Oman, UAE, Kuwait and Qatar) add up to 1,772 million barrels, 43.7% of the total. The “more than half” caption only holds if Iranian oil is counted, and Iran has no value on the map. Econovis makes the same point in its text by naming Iran [1].
- Malaysia. The note that Malaysian volumes are likely Iranian oil is the creator’s inference from trade data, not a figure recorded by China’s customs.
- Source line. The footer reads “Customs of of China”, with “of” printed twice.
- Date. The data is for 2024. China imported more in 2025 and less in mid 2026 [5].
Questions about China’s oil imports
Where does China get its oil?
In 2024 Russia supplied the most crude oil to China, followed by Saudi Arabia, Malaysia, Iraq, Oman, the UAE, Brazil, Angola, Kuwait and Qatar. Smaller amounts came from Africa, the Americas, Europe and Australia. China also produces its own crude: Econovis gives domestic output as 4.1 million barrels a day in 2022 [1].
Who is the biggest supplier of oil to China?
Russia. It shipped 2.19 million barrels a day in 2024, 41% more than Saudi Arabia’s 1.55 million [4]. The EIA still named Russia as China’s top source in 2026 [5].
How much oil does China import?
About 11.1 million barrels a day in 2024 [3] and a record 11.6 million barrels a day in 2025 [5].
Does China get oil from Iran?
Not directly in the customs data used for this map. Econovis says direct Iranian crude exports to China have been absent since 2020, and that part of the oil recorded as Malaysian is likely Iranian [2].
Sources
- Econovis, China’s Top Crude Oil Suppliers (2000 to 2024)
- Econovis, China’s Top Crude Oil Suppliers, A Two-Decade Transformation (2000 to 2024)
- Econovis, China’s Crude Oil Imports Reach 11.1 Mb/D in 2024, Down 1.9% from 2023
- Econovis, Russia Becomes China’s Top Crude Oil Supplier in 2024 with 2.19 Mb/D
- U.S. Energy Information Administration, China’s crude oil imports fell in the second quarter (31 July 2026)
Last reviewed 29 October 2026