

Wealth and Income
Median Household Income by Ethnic Group in the US
In 2025 the Census Bureau put Asian households at $126,300, non-Hispanic White households at $96,710, Hispanic households at $73,260 and Black households at…
This hub covers how people live together, including religion, surnames, legal ages, happiness, prisons and homelessness, with sections for population and for relationships and family. Each page shows the original graphic with credit, gives the full figures as text and links to the census or survey behind them. Start with the world as 100 people, the US religion map by county, the top 25 surnames by state, the age of adulthood in 12 countries or the World Happiness Report map. Most figures come from national censuses and large surveys such as those run by Pew and Ipsos.
In 2025 the Census Bureau put Asian households at $126,300, non-Hispanic White households at $96,710, Hispanic households at $73,260 and Black households at…
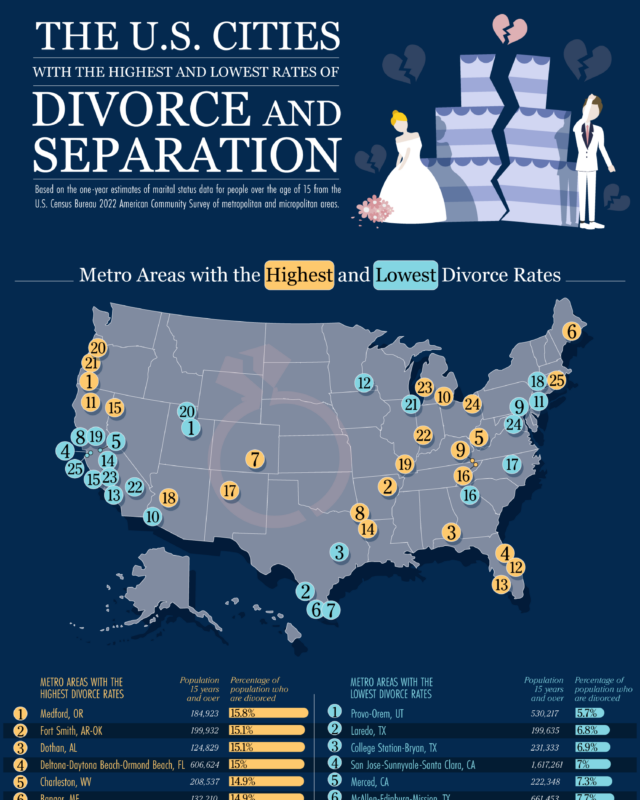
Fort Smith (Arkansas and Oklahoma) and Dothan (Alabama) follow at 15.1%.

Relative to population Sudan lost the most, about 270 people per 10,000 residents, followed by Kosovo, Greece and Nepal.

Between 1990 and 2023 Luxembourg grew most, by 74%, followed by Cyprus, Turkey, Andorra and Iceland, while Moldova lost 31% of its people, followed by…

That is just under half (about 47%) of all homes, down from 78% in 1950.

Afghanistan came last of 143 countries at 1.721, and the United States dropped out of the top 20 to 23rd.

National Geographic's map of each state's 25 most common surnames shows English and Welsh names across the South and East, German and Scandinavian names in…

West Virginia, New Mexico, Kentucky, Arkansas and Alabama are also above 15%.

Some places set it at 16, 19, 20 or 21.

In the 2021 Census, 53.3% of Canadians reported a Christian religion, down from 77.1% in 2001, while 34.6% reported no religion at all.

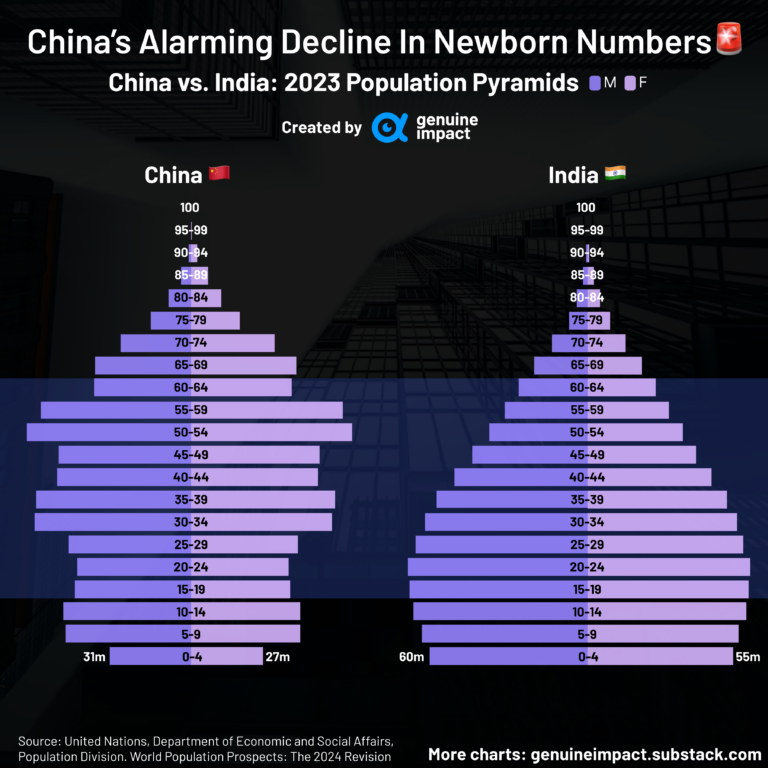
India has overtaken China as the most populous country, China's population is set to more than halve by 2100, and most future growth will come from Africa…
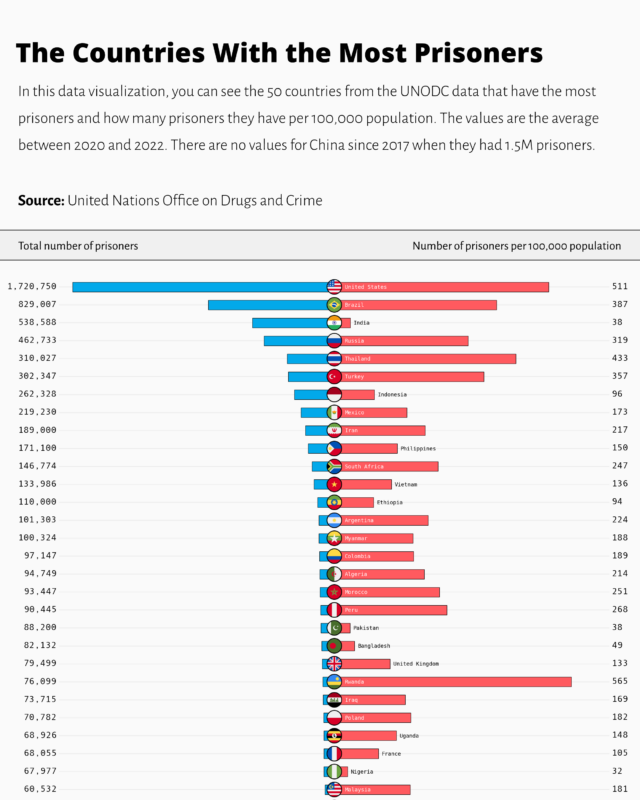
The United States also holds the most prisoners, about 1.83 million, ahead of China and Brazil.
The 39 infographics in this collection cover religion and religious symbols on flags, surnames, world and national population, population growth, income, poverty and social class, prisons and homelessness, happiness, legal ages and public holidays. They also cover marriage, divorce, dating and parenting. Most focus on the United States, and others cover the whole world, Canada, the EU, China, India and Mexico.
For a picture of the whole world, The World as 100 People by designer Jack Hagley shows that 60 of the 100 would live in Asia, 83 could read and write and 30 could access the internet. The World Population Infographic, Most Populous Countries to 2100 looks ahead. India stays first and peaks at 1,680 million in 2050, while China falls from 1,419 million in 2024 to 633 million by 2100.
On religion, the US Religion Map by County by Reddit user Mission-Guidance4782 colours each county by its largest religious group in the 2020 U.S. Religion Census. Catholic counties lead in the Northeast, the Southwest and California, and Baptist counties lead across the South. Religion in Canada 1931 to 2021 shows the number of Christians peaking at 22.7 million in 2001 and falling to 19.4 million by 2021. Over the same period, people with no religion rose from 21,155 in 1931 to 12.6 million.
For prisons and housing, Incarceration Rates by Country and the 50 Largest Prison Totals from World Charts shows the United States with the most prisoners, 1,720,750, and El Salvador with the highest rate, 624 per 100,000. Vacant Homes vs Homeless People in Every US State by MortgageCalculator.org counts 21.56 vacant housing units per homeless person nationally in 2023, from 187.31 in Mississippi down to 5.86 in California.
The Population and Demographics and Relationships and Family sections hold the graphics on those two themes.
The United States, with 1,720,750 prisoners, about twice Brazil's 829,007, on the World Charts graphic of UNODC data averaged over 2020 to 2022. El Salvador has the highest rate on the chart, at 624 per 100,000 people.
Finland, with a score of 7.7 out of 10 on Visual Capitalist's World Happiness Report 2024 map, followed by Denmark (7.6) and Iceland (7.5). Afghanistan is the least happy at 1.7.
Los Angeles City and County, with 65,111 people experiencing homelessness in 2022, according to the Statista chart based on HUD's single night count. New York City was second with 61,840.
Give it a permanent page where people looking for your subject find it, with your name and a link to your site. Content marketers, agencies, designers and researchers all list here.