Key figures
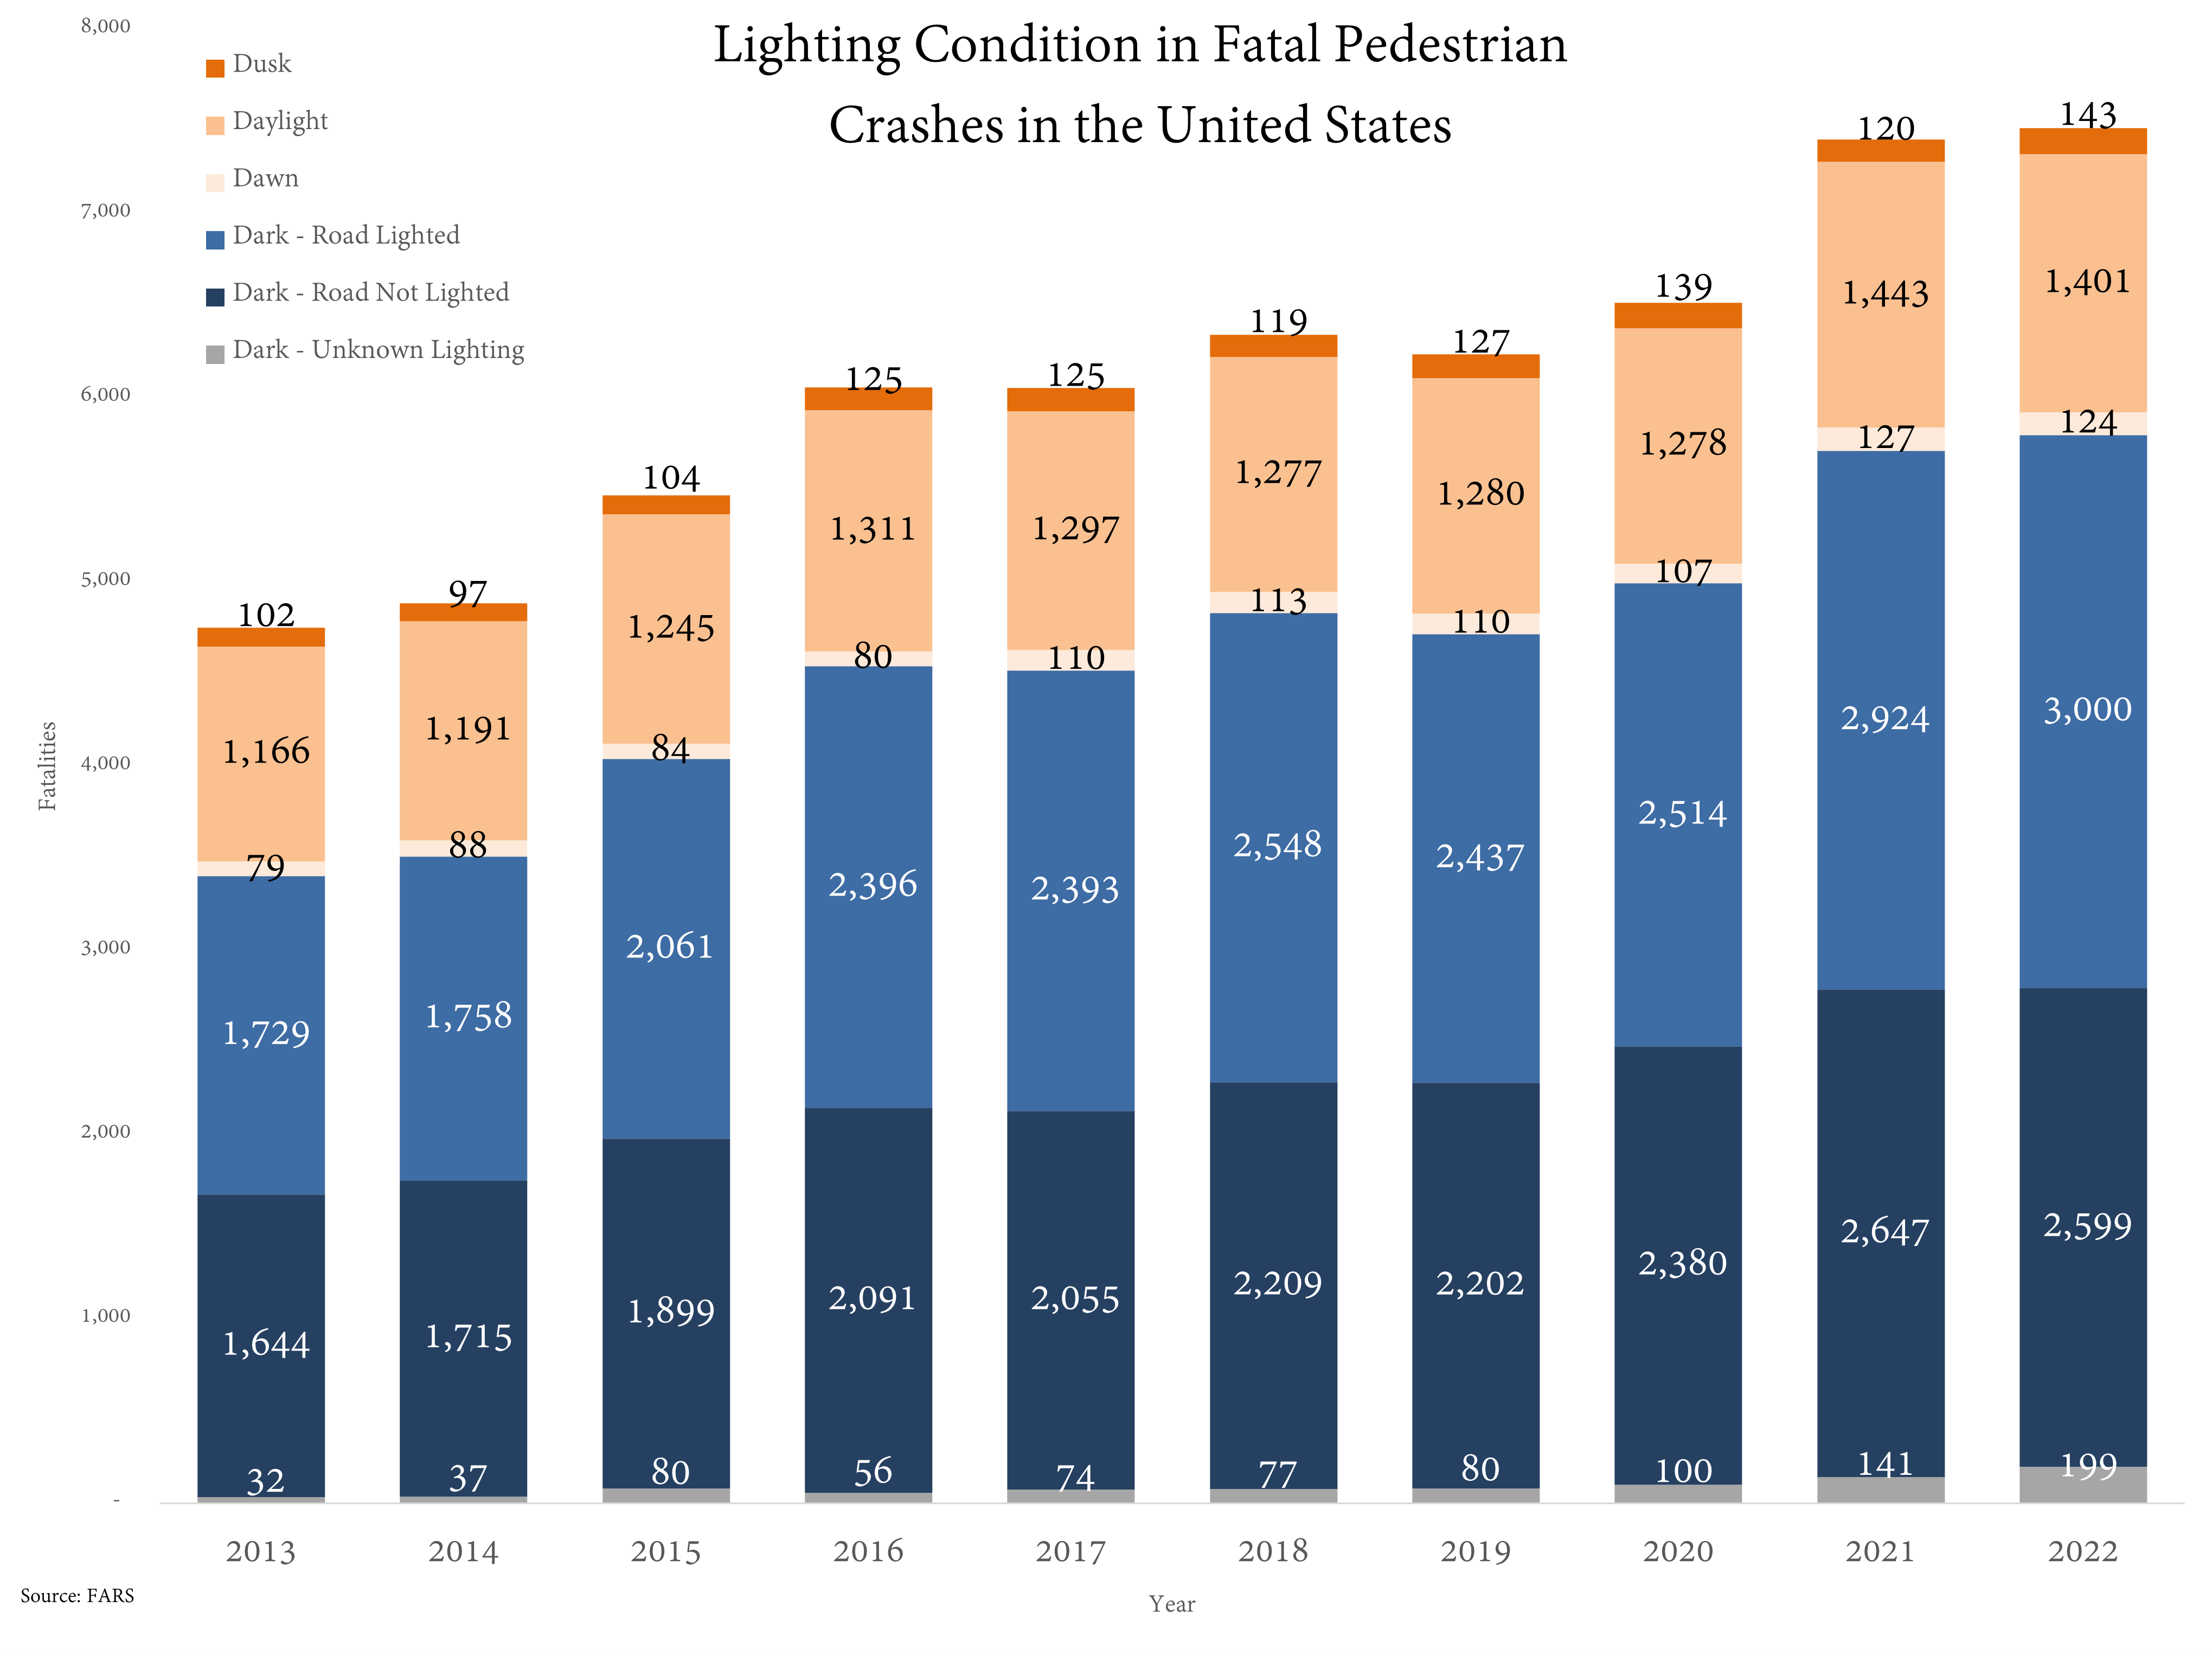
- Pedestrian deaths in the chart’s six lighting categories rose from 4,752 in 2013 to 7,466 in 2022, an increase of 57% (our sums).
- Most deaths happen in the dark. The three dark categories made up 72% of the total in 2013 and 78% in 2022.
- “Dark, road lighted” is the largest category in every year, rising from 1,729 to 3,000 (74% more).
- Daylight deaths grew more slowly, from 1,166 to 1,401 (20% more). Dawn and dusk each account for under 150 deaths a year.
Fatal pedestrian crashes by lighting condition, in text
Title: “Lighting Condition in Fatal Pedestrian Crashes in the United States”. The chart is a stacked bar chart of pedestrian fatalities for each year from 2013 to 2022, split into six lighting conditions, with each segment labelled. Y axis “Fatalities” from 0 to 8,000. Source printed on the chart: FARS, the Fatality Analysis Reporting System run by the US National Highway Traffic Safety Administration (NHTSA).
| Year | Dark, road lighted | Dark, road not lighted | Dark, unknown lighting | Daylight | Dawn | Dusk | Total (our sum) | Share in the dark (our arithmetic) |
|---|---|---|---|---|---|---|---|---|
| 2013 | 1,729 | 1,644 | 32 | 1,166 | 79 | 102 | 4,752 | 72% |
| 2014 | 1,758 | 1,715 | 37 | 1,191 | 88 | 97 | 4,886 | 72% |
| 2015 | 2,061 | 1,899 | 80 | 1,245 | 84 | 104 | 5,473 | 74% |
| 2016 | 2,396 | 2,091 | 56 | 1,311 | 80 | 125 | 6,059 | 75% |
| 2017 | 2,393 | 2,055 | 74 | 1,297 | 110 | 125 | 6,054 | 75% |
| 2018 | 2,548 | 2,209 | 77 | 1,277 | 113 | 119 | 6,343 | 76% |
| 2019 | 2,437 | 2,202 | 80 | 1,280 | 110 | 127 | 6,236 | 76% |
| 2020 | 2,514 | 2,380 | 100 | 1,278 | 107 | 139 | 6,518 | 77% |
| 2021 | 2,924 | 2,647 | 141 | 1,443 | 127 | 120 | 7,402 | 77% |
| 2022 | 3,000 | 2,599 | 199 | 1,401 | 124 | 143 | 7,466 | 78% |
What NHTSA’s figures add
NHTSA’s fact sheet on 2022 pedestrian data reports 7,522 pedestrians killed in traffic crashes that year, a 0.7% increase on 2021 and the highest number since 1981 [1]. It says more pedestrian fatalities occurred in the dark (78%) than in daylight (19%), dusk (2%) and dawn (2%) [1], which matches the pattern in the chart.
The same fact sheet gives other details about these deaths in 2022 [1]:
- Pedestrian deaths were 18% of all traffic fatalities.
- 85% occurred in urban areas and 15% in rural areas.
- 75% occurred at locations that were not intersections, and 16% at intersections.
- Alcohol involvement, for the driver or the pedestrian, was reported in 48% of fatal pedestrian crashes.
- Nearly 1 in 4 pedestrians killed (24%) were struck by hit and run drivers.
NHTSA’s pedestrian safety page reports 7,080 pedestrians killed in 2024, one every 74 minutes [2].
Notes on this infographic
- Totals differ slightly from NHTSA’s. The chart’s six categories add up to 7,466 for 2022 and 4,752 for 2013 (our sums), while NHTSA reports 7,522 and 4,779 pedestrian deaths for those years [1]. The gap is most likely deaths with other or unknown lighting recorded outside these six categories, but the chart does not say.
- Lit roads. The chart shows more deaths on lit roads at night than on unlit ones in every year. It does not show how much walking or driving happens on each kind of road, so it cannot say which is riskier per trip.
- Unknown lighting. The “Dark, unknown lighting” category grew from 32 to 199, which may reflect recording practice rather than a change on the road.
- No totals or percentages printed. Totals and shares on this page are our arithmetic from the printed segment values.
- Creator. The chart credits only its data source, FARS. We could not identify who made it.
Questions about US pedestrian deaths by lighting
What percentage of pedestrian deaths happen in the dark?
In 2022, 78% of US pedestrian fatalities occurred in the dark, against 19% in daylight, 2% at dusk and 2% at dawn [1]. The chart's three dark categories rose from 72% of the total in 2013 to 78% in 2022. Daylight deaths grew more slowly, from 1,166 to 1,401.
How many pedestrians were killed in the US in 2022?
NHTSA reports 7,522 pedestrians killed in traffic crashes in 2022, a 0.7% increase on 2021 and the highest number since 1981 [1]. Pedestrian deaths were 18% of all traffic fatalities that year [1]. The chart's six lighting categories add up to a slightly lower 7,466 for 2022.
Are more pedestrians killed on lit or unlit roads at night?
More pedestrians are killed on lit roads at night than on unlit ones in every year from 2013 to 2022. In 2022 there were 3,000 deaths on dark, lit roads against 2,599 on dark, unlit roads. The chart does not show how much walking or driving happens on each kind of road, so it cannot say which is riskier per trip.
How many pedestrians were killed in the US in 2024?
NHTSA reports 7,080 pedestrians killed in 2024, one every 74 minutes [2]. That is fewer than the 7,522 pedestrian deaths it reported for 2022, the highest number since 1981 [1]. The lighting chart itself covers only 2013 to 2022, so it does not show 2024 by lighting condition.
Sources
- NHTSA, Traffic Safety Facts, 2022 Data, Pedestrians (DOT HS 813 590).
- NHTSA, Pedestrian Safety.
Last reviewed 30 October 2026