Key figures from the chart
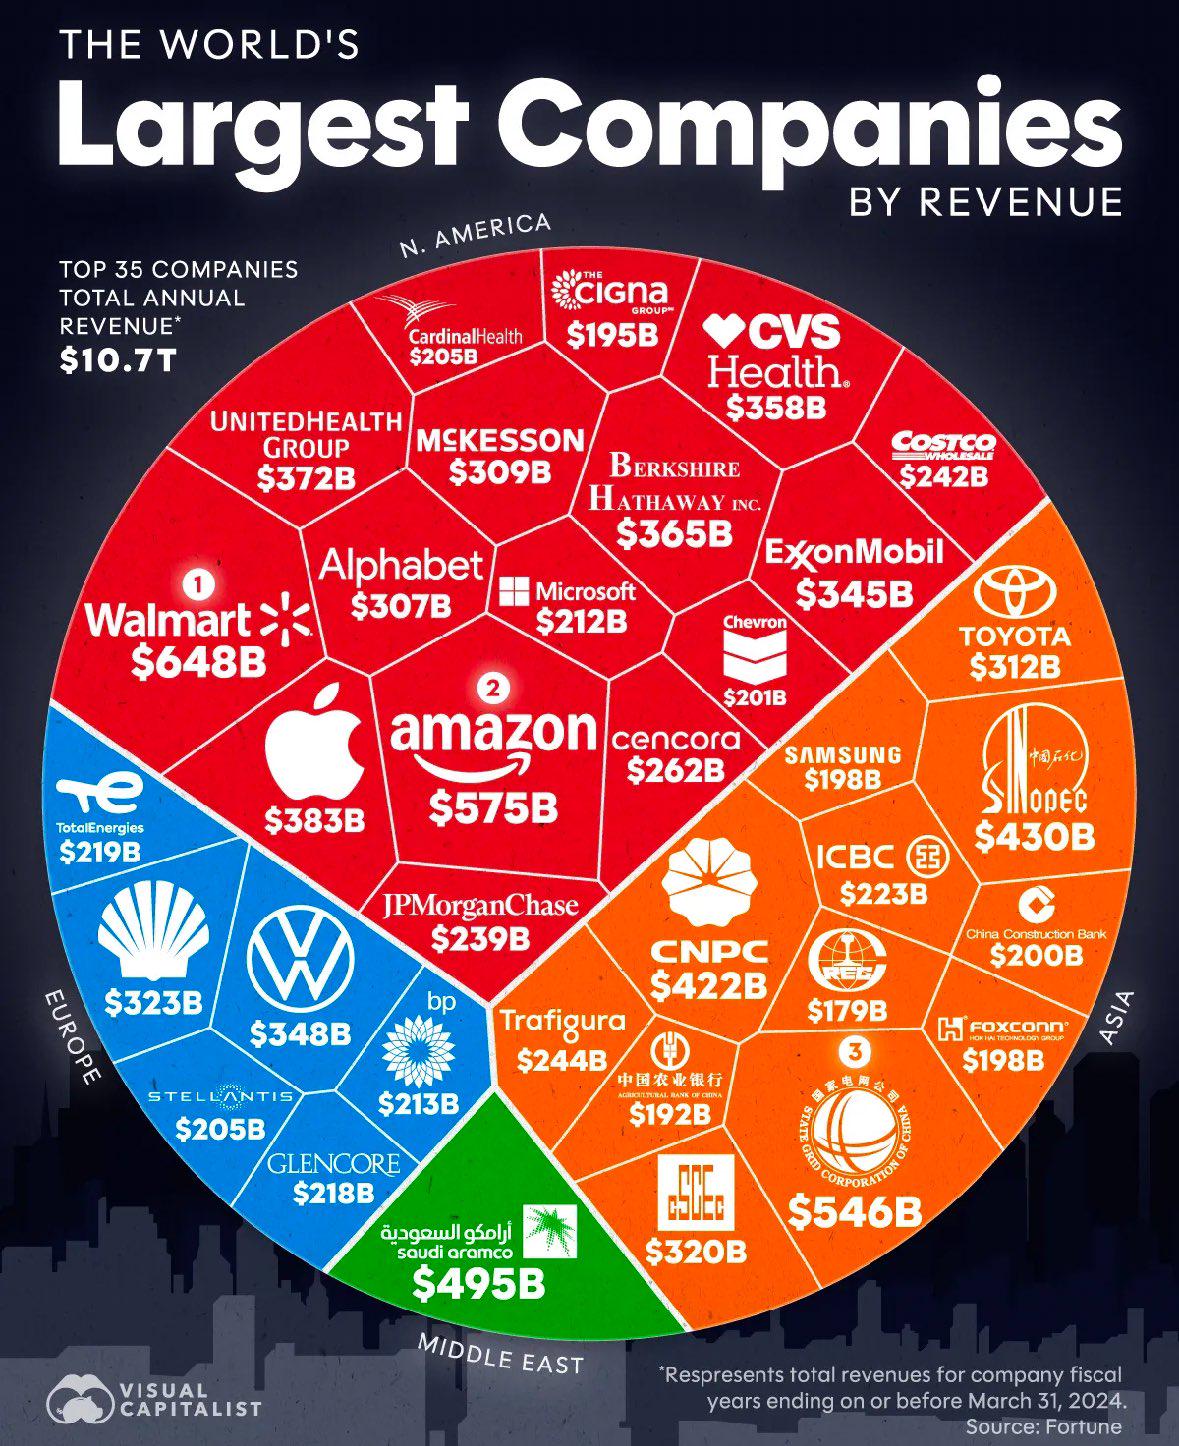
- The 35 largest companies in the world by revenue took in a combined $10.7 trillion, according to the chart. Our sum of the 35 printed values is $10.70 trillion.
- Walmart is first at $648 billion, Amazon second at $575 billion and State Grid of China third at $546 billion.
- North America has 16 of the 35 companies, Asia 12, Europe 6 and the Middle East 1, Saudi Aramco.
- Energy and commodities firms are a large share of the list: Saudi Aramco, Sinopec, CNPC, ExxonMobil, Shell, Trafigura, TotalEnergies, Glencore, BP and Chevron.
- Figures are total revenues for fiscal years ending on or before 31 March 2024, from Fortune.
The largest companies in the world by revenue in text
The chart is a circle divided into cells sized by revenue. It prints no ranks beyond the top three, so the ranks below are the companies’ positions in the Fortune Global 500 for 2024, which uses the same figures [2].
| Rank | Company | Revenue on the chart | Region colour |
|---|---|---|---|
| 1 | Walmart | $648B | North America |
| 2 | Amazon | $575B | North America |
| 3 | State Grid | $546B | Asia |
| 4 | Saudi Aramco | $495B | Middle East |
| 5 | Sinopec | $430B | Asia |
| 6 | CNPC (China National Petroleum) | $422B | Asia |
| 7 | Apple | $383B | North America |
| 8 | UnitedHealth Group | $372B | North America |
| 9 | Berkshire Hathaway | $365B | North America |
| 10 | CVS Health | $358B | North America |
| 11 | Volkswagen | $348B | Europe |
| 12 | ExxonMobil | $345B | North America |
| 13 | Shell | $323B | Europe |
| 14 | China State Construction | $320B | Asia |
| 15 | Toyota | $312B | Asia |
| 16 | McKesson | $309B | North America |
| 17 | Alphabet | $307B | North America |
| 18 | Cencora | $262B | North America |
| 19 | Trafigura | $244B | Asia |
| 20 | Costco Wholesale | $242B | North America |
| 21 | JPMorgan Chase | $239B | North America |
| 22 | ICBC | $223B | Asia |
| 23 | TotalEnergies | $219B | Europe |
| 24 | Glencore | $218B | Europe |
| 25 | BP | $213B | Europe |
| 26 | Microsoft | $212B | North America |
| 27 | Cardinal Health | $205B | North America |
| 28 | Stellantis | $205B | Europe |
| 29 | Chevron | $201B | North America |
| 30 | China Construction Bank | $200B | Asia |
| 31 | Samsung | $198B | Asia |
| 32 | Foxconn (Hon Hai) | $198B | Asia |
| 33 | The Cigna Group | $195B | North America |
| 34 | Agricultural Bank of China | $192B | Asia |
| 35 | China Railway | $179B | Asia |
By region
| Region | Companies | Combined revenue (our sum) |
|---|---|---|
| North America | 16 | $5,218 billion |
| Asia | 12 | $3,464 billion |
| Europe | 6 | $1,526 billion |
| Middle East | 1 | $495 billion |
| Total | 35 | $10,703 billion |
What the ranking measures
The list ranks companies by revenue, not by profit or stock market value. Fortune’s ranking includes public and private companies that report financial data, so state-owned groups such as State Grid, Sinopec and CNPC appear alongside listed companies [1].
Fortune reports that the 500 companies on its 2024 list had combined revenues of $41 trillion in 2023, up 0.1% on the year before [2]. Walmart was first for the 11th year in a row, and Amazon rose to second from fourth [2]. For the first time since 2018 the United States had more companies on the list, 139, than Greater China, with 133 [2].
Visual Capitalist adds that Walmart generates nearly $74 million in revenue every hour, and that State Grid is the world’s largest copper buyer because of the metal’s role in power grids [1].
Notes on this infographic
- Typing error. The footnote reads “Respresents” for “Represents”.
- Rounding. Values are rounded to the nearest billion. Fortune lists Amazon at $574.8 billion and State Grid at $545.9 billion [2], which the chart shows as $575 billion and $546 billion.
- Which year. The page address says 2023. The chart covers fiscal years ending by 31 March 2024, which for most of these companies is calendar 2023 [1].
- Names. Several companies appear as logos only. We have named them in the table: Apple, Shell, Volkswagen, China State Construction and China Railway.
Questions about the largest companies in the world
What is the biggest company in the world?
By revenue, Walmart, with $648 billion in this ranking [1][2]. The answer depends on the measure. By stock market value, Wikipedia records Nvidia as the first company to pass $5 trillion, on 29 October 2025 [3].
Which company has the highest revenue?
Walmart. Fortune’s 2024 Global 500 lists its revenue at $648.1 billion, ahead of Amazon at $574.8 billion and State Grid at $545.9 billion [2].
How many of the world's largest companies are in North America?
North America has 16 of the 35 largest companies in the world by revenue. Asia has 12, Europe 6 and the Middle East 1, Saudi Aramco. Added together, the 16 North American companies took in $5,218 billion of the $10,703 billion total for all 35, with Walmart, Amazon, Apple and UnitedHealth Group the biggest of them.
How much revenue does Walmart make per hour?
Walmart generates nearly $74 million in revenue every hour, according to Visual Capitalist [1]. Its total revenue on the chart is $648 billion, which puts it first among the world's largest companies, ahead of Amazon at $575 billion and State Grid at $546 billion. Fortune's 2024 Global 500 placed Walmart first for the 11th year in a row [2].
Sources
- Voronoi by Visual Capitalist, The World’s Largest Companies by Revenue, the original post for this chart.
- Fortune, Global 500, 2024.
- Wikipedia, List of public corporations by market capitalization.
- Visual Capitalist, visualcapitalist.com, maker of the chart.
Last reviewed 29 October 2026