Key points from the infographic
- The USA ranks first at all four Summer Games from London 2012 to Paris 2024, peaking at 126 medals in Paris.
- China is second at every Games except Rio 2016, when Great Britain took second place.
- Host nations rise: Great Britain is third at London 2012, Japan fifth at Tokyo 2020 with 27 golds, and France third at Paris 2024.
- Ranks use weighted points (gold 3, silver 2, bronze 1), so a team with fewer medals can rank above one with more.
- Across the four Games the USA won 464 medals and China 342 in these tables (our sums).
Olympics over the years, the infographic in text
Title: Top 10 Olympic teams over 12 years. Four columns, one for each Summer Games, list the top 10 teams with their flag, gold, silver and bronze medal counts, and a ribbon with the total. Footnote: Rankings based on weighted totals (G = 3, S = 2, B = 1). Source: Olympics.com. Badge: created by Lemonly. The weighted points column is our arithmetic from the printed counts.
2012 London
| Rank | Team | Gold | Silver | Bronze | Total | Weighted points |
|---|---|---|---|---|---|---|
| 1 | USA | 48 | 26 | 30 | 104 | 226 |
| 2 | China | 39 | 31 | 22 | 92 | 201 |
| 3 | Great Britain | 29 | 18 | 18 | 65 | 141 |
| 4 | Russia | 18 | 21 | 26 | 65 | 122 |
| 5 | Germany | 11 | 20 | 13 | 44 | 86 |
| 6 | France | 11 | 11 | 13 | 35 | 68 |
| 7 | Japan | 7 | 14 | 17 | 38 | 66 |
| 8 | Australia | 8 | 15 | 12 | 35 | 66 |
| 9 | South Korea | 13 | 9 | 9 | 31 | 66 |
| 10 | Italy | 8 | 9 | 11 | 28 | 53 |
2016 Rio De Janeiro
| Rank | Team | Gold | Silver | Bronze | Total | Weighted points |
|---|---|---|---|---|---|---|
| 1 | USA | 46 | 37 | 38 | 121 | 250 |
| 2 | Great Britain | 27 | 23 | 17 | 67 | 144 |
| 3 | China | 26 | 18 | 26 | 70 | 140 |
| 4 | Russia | 19 | 17 | 20 | 56 | 111 |
| 5 | Germany | 17 | 10 | 15 | 42 | 86 |
| 6 | France | 10 | 18 | 14 | 42 | 80 |
| 7 | Japan | 12 | 8 | 21 | 41 | 73 |
| 8 | Australia | 8 | 11 | 10 | 29 | 56 |
| 9 | Italy | 8 | 12 | 8 | 28 | 56 |
| 10 | South Korea | 9 | 3 | 9 | 21 | 42 |
2020 Tokyo
| Rank | Team | Gold | Silver | Bronze | Total | Weighted points |
|---|---|---|---|---|---|---|
| 1 | USA | 39 | 41 | 33 | 113 | 232 |
| 2 | China | 38 | 32 | 19 | 89 | 197 |
| 3 | Russia (ROC) | 20 | 28 | 23 | 71 | 139 |
| 4 | Great Britain | 22 | 20 | 22 | 64 | 128 |
| 5 | Japan | 27 | 14 | 17 | 58 | 126 |
| 6 | Australia | 17 | 7 | 22 | 46 | 87 |
| 7 | Italy | 10 | 10 | 20 | 40 | 70 |
| 8 | Germany | 10 | 11 | 16 | 37 | 68 |
| 9 | Netherlands | 10 | 12 | 14 | 36 | 68 |
| 10 | France | 10 | 12 | 11 | 33 | 65 |
2024 Paris
| Rank | Team | Gold | Silver | Bronze | Total | Weighted points |
|---|---|---|---|---|---|---|
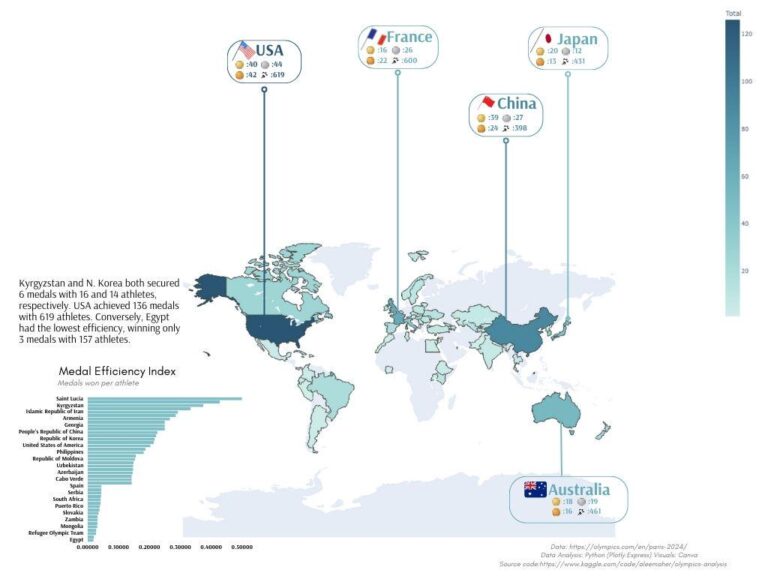
| 1 | USA | 40 | 44 | 42 | 126 | 250 |
| 2 | China | 40 | 27 | 24 | 91 | 198 |
| 3 | France | 16 | 26 | 22 | 64 | 122 |
| 4 | Great Britain | 14 | 22 | 29 | 65 | 115 |
| 5 | Australia | 18 | 19 | 16 | 53 | 108 |
| 6 | Japan | 20 | 12 | 13 | 45 | 97 |
| 7 | Italy | 12 | 13 | 15 | 40 | 77 |
| 8 | Netherlands | 15 | 7 | 12 | 34 | 71 |
| 9 | Germany | 12 | 13 | 8 | 33 | 70 |
| 10 | South Korea | 13 | 9 | 10 | 32 | 67 |
How the weighting changes the order
Lemonly ranks teams by weighted points rather than by total medals or by golds alone [1]. That moves three pairs. At London 2012 France (35 medals, 68 points) sits above Japan (38 medals, 66 points). At Rio 2016 Great Britain (67 medals, 144 points) sits above China (70 medals, 140 points). At Paris 2024 France (64 medals, 122 points) sits above Great Britain (65 medals, 115 points).
Wikipedia’s medal tables are ordered by default by the number of gold medals [4] [5]. Ranked that way, Japan’s 27 golds at Tokyo 2020 would put it above Russia (ROC) with 20 and Great Britain with 22, but the weighted ranking puts Japan fifth, behind both, because they won more silver and bronze medals.
Teams in all four Games
Eight teams appear in all four top 10s: the USA, China, Great Britain, Germany, France, Japan, Australia and Italy. Russia is in the first three, as Russia (ROC) in 2020, when its athletes competed as the Russian Olympic Committee, and it does not appear in 2024. South Korea appears in 2012, 2016 and 2024, and the Netherlands in 2020 and 2024.
Notes on this infographic
- London 2012 figures. Medals from London 2012 have been reallocated after doping cases. Wikipedia’s current table gives the USA 48 gold, 26 silver and 32 bronze (106) and Russia 18 gold, 19 silver and 26 bronze (63) [2], against 48, 26, 30 (104) and 18, 21, 26 (65) on the graphic. The other 2012 rows on the graphic match Wikipedia’s current table [2].
- Later Games. Every row for Rio 2016, Tokyo 2020 and Paris 2024 matches Wikipedia’s medal tables [3] [4] [5].
Questions about Olympic teams
Which country is the most successful at the Olympics?
Over these four Summer Games, the USA. It tops the graphic every time, with 104, 121, 113 and 126 medals, ahead of China, which won 92, 70, 89 and 91.
Who topped the Olympic medal table in 2024?
The USA, with 40 gold, 44 silver and 42 bronze, 126 in all. China also won 40 golds, with 27 silver and 24 bronze, 91 in all [5].
Sources
- Lemonly, Top 10 Olympic Teams from London 2012 to Paris 2024, the creator’s page for this infographic.
- Wikipedia, 2012 Summer Olympics medal table.
- Wikipedia, 2016 Summer Olympics medal table.
- Wikipedia, 2020 Summer Olympics medal table.
- Wikipedia, 2024 Summer Olympics medal table.
Last reviewed 30 October 2026