Key points
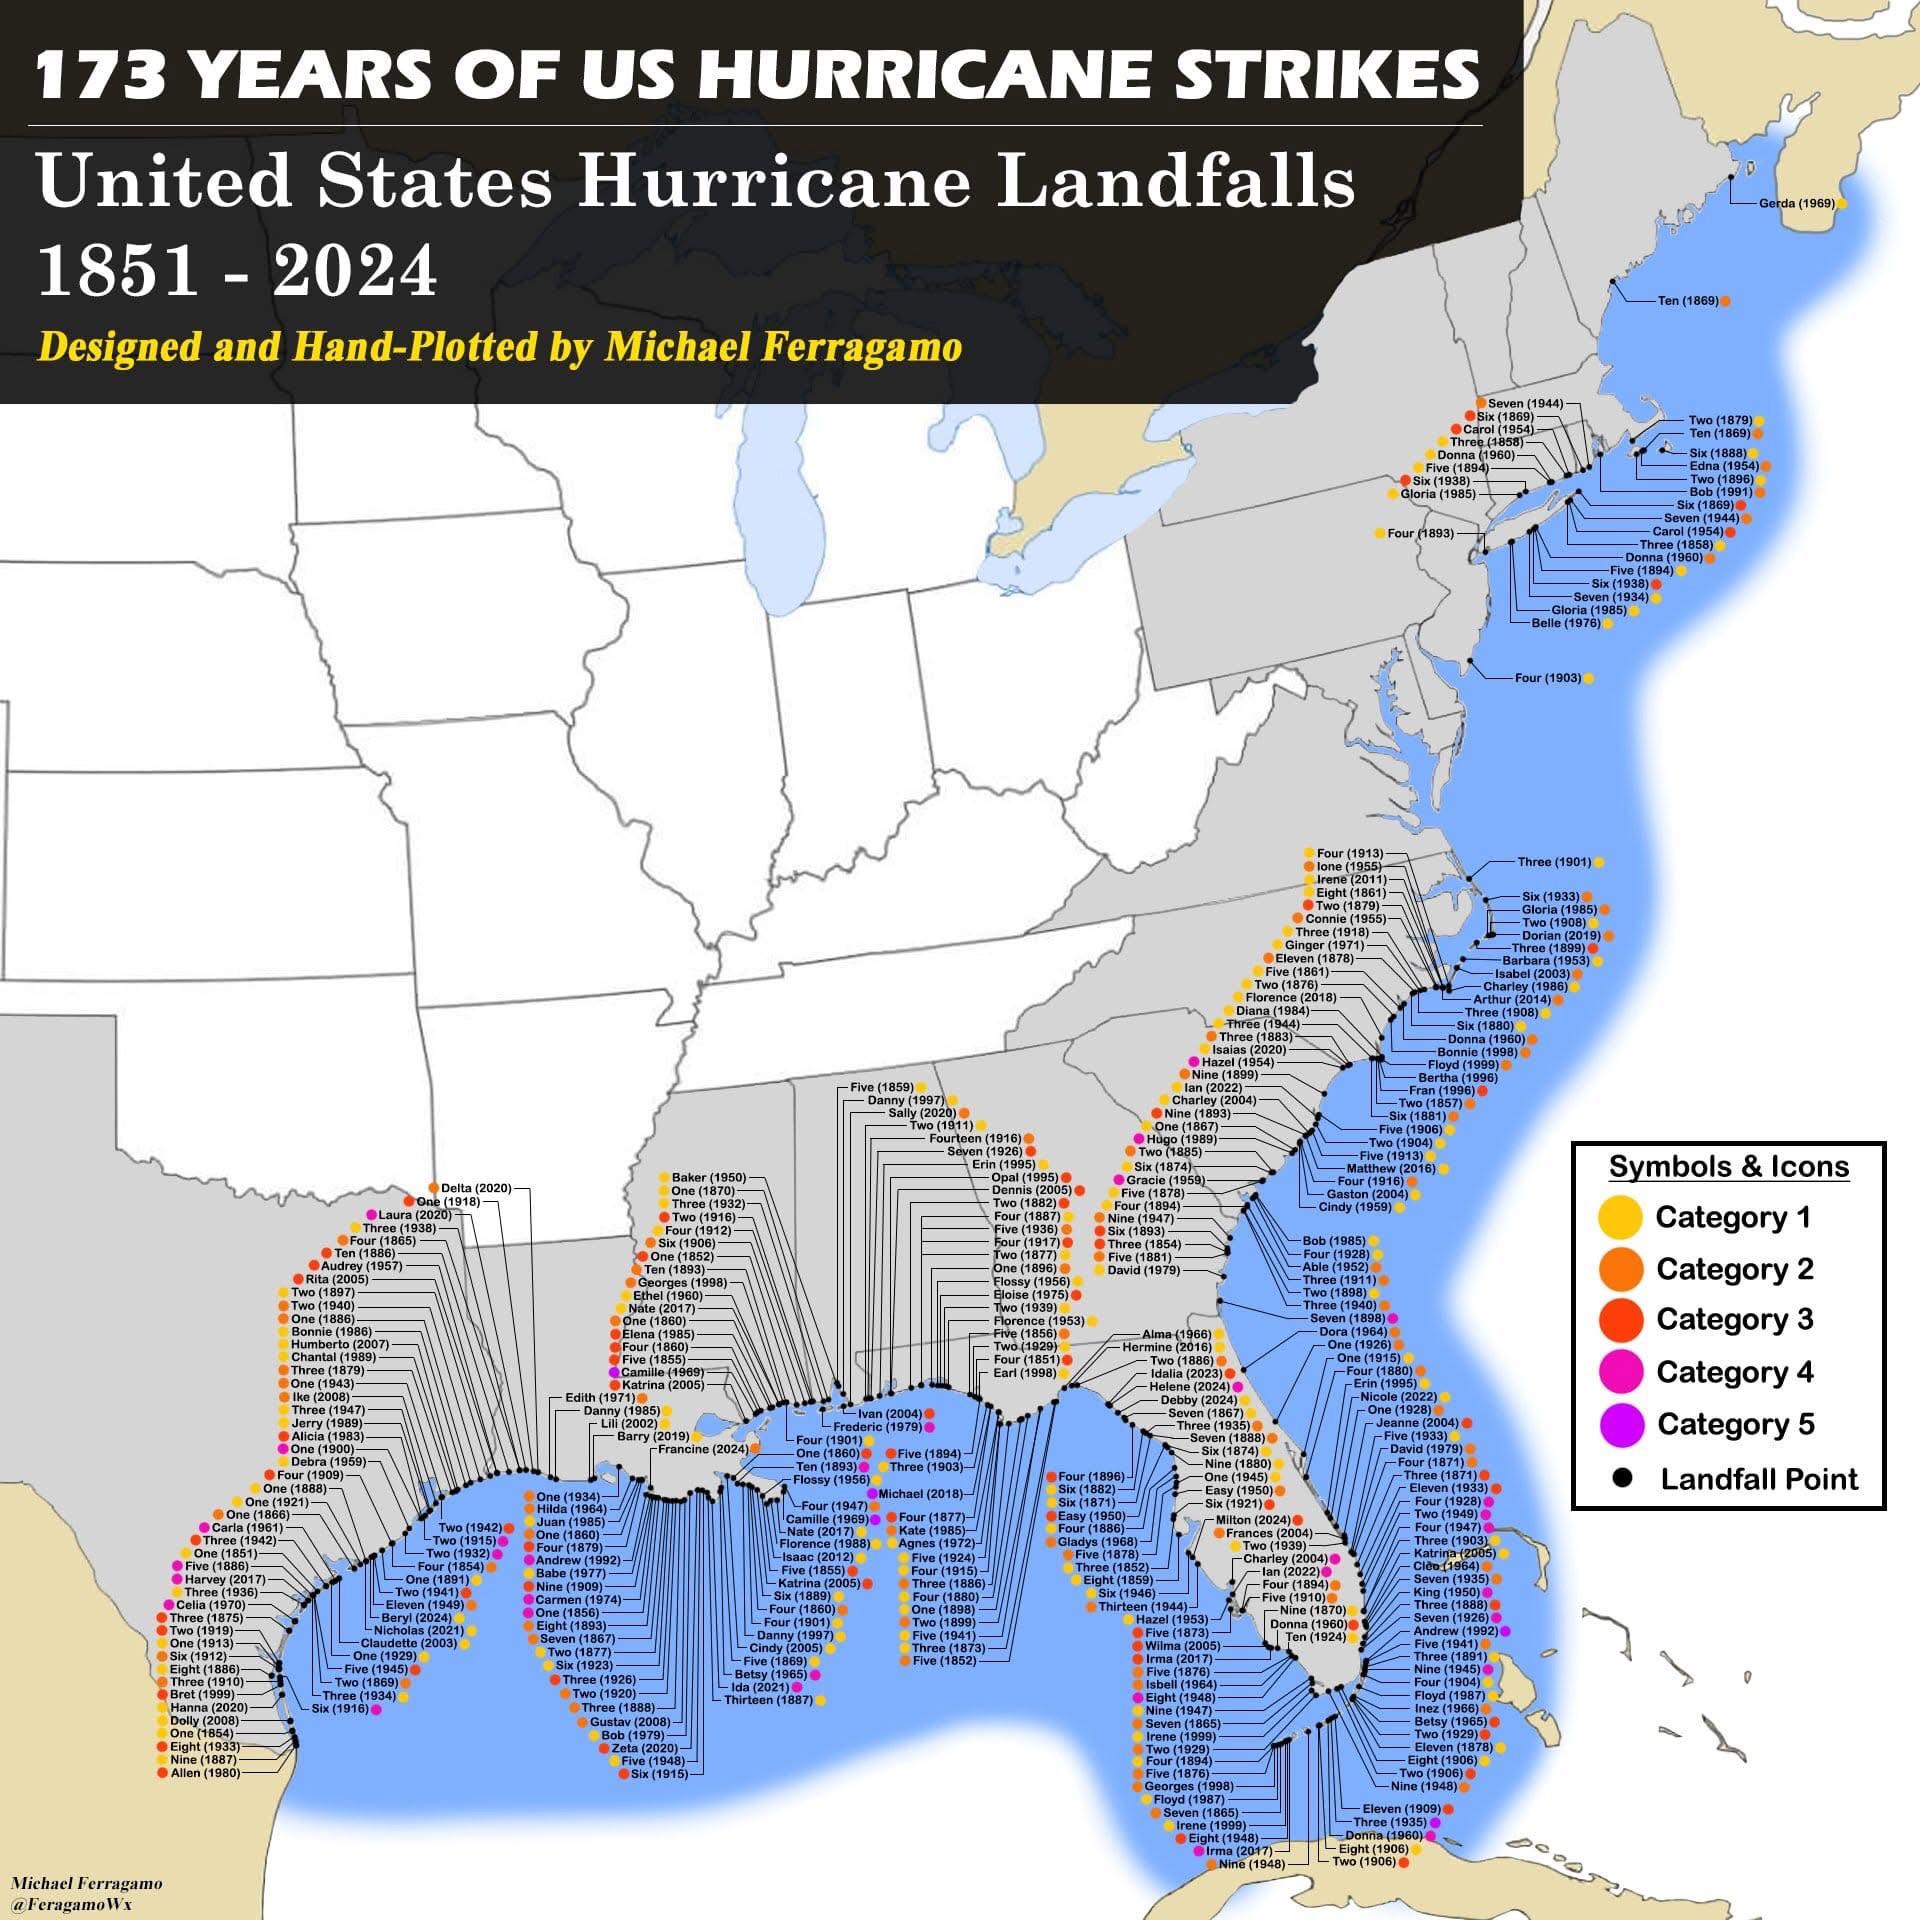
- Every dot on the coast is a hurricane landfall on the US mainland between 1851 and 2024, joined by a leader line to a label giving the storm’s name (or season number) and year.
- A coloured circle beside each label shows its Saffir-Simpson category at landfall, from Category 1 (yellow) to Category 5 (purple).
- Labels crowd the Texas and Louisiana coasts, the Florida Panhandle, South Florida and the Carolinas, and thin out north of New Jersey.
- Four purple Category 5 markers appear: the 1935 Labor Day hurricane in the Florida Keys, Camille (1969), Andrew (1992) and Michael (2018). NOAA lists the same four [3].
The US hurricane history map in text
Title: 173 Years of US Hurricane Strikes. Subtitle: United States Hurricane Landfalls 1851 – 2024. Credit: Designed and Hand-Plotted by Michael Ferragamo; signature “Michael Ferragamo @FeragamoWx” in the bottom left corner.
Legend (Symbols & Icons): Category 1 (yellow), Category 2 (orange), Category 3 (red), Category 4 (pink), Category 5 (purple), Landfall Point (black dot).
Map: the eastern and central United States from the Mexican border to Maine, with coastal states shaded grey, Canada and Mexico in tan and a blue band along the Gulf and Atlantic shoreline. Storms before regular naming are labelled by their number in the season, such as “Six (1938)” for the 1938 New England hurricane or “One (1900)” for the Galveston hurricane. Storms that came ashore more than once, such as Katrina (2005), Andrew (1992) and Donna (1960), have more than one label.
Named storms on the map, by stretch of coast (our reading of the small labels, west to east):
- Texas: Allen (1980), Dolly (2008), Hanna (2020), Bret (1999), Celia (1970), Harvey (2017), Carla (1961), Debra (1959), Alicia (1983), Jerry (1989), Ike (2008), Chantal (1989), Humberto (2007), Bonnie (1986), Rita (2005), Audrey (1957), Laura (2020), Delta (2020), Beryl (2024), Nicholas (2021) and Claudette (2003).
- Louisiana and Mississippi: Camille (1969), Katrina (2005), Betsy (1965), Ida (2021), Elena (1985), Georges (1998), Ethel (1960), Nate (2017), Florence (1988), Isaac (2012), Cindy (2005), Danny (1997), Baker (1950), Edith (1971), Danny (1985), Lili (2002), Barry (2019), Francine (2024), Hilda (1964), Juan (1985), Babe (1977), Carmen (1974), Gustav (2008), Bob (1979) and Zeta (2020).
- Alabama and the Florida Panhandle: Michael (2018), Ivan (2004), Frederic (1979), Opal (1995), Dennis (2005), Eloise (1975), Sally (2020), Erin (1995), Danny (1997), Flossy (1956), Florence (1953), Earl (1998), Kate (1985) and Agnes (1972).
- Florida peninsula and Keys: Andrew (1992), Donna (1960), Irma (2017), Wilma (2005), Charley (2004), Ian (2022), Milton (2024), Helene (2024), Idalia (2023), Debby (2024), Hermine (2016), Alma (1966), Easy (1950), King (1950), Frances (2004), Jeanne (2004), Katrina (2005), Cleo (1964), Betsy (1965), Isbell (1964), Inez (1966), Gladys (1968), Hazel (1953), Irene (1999), Georges (1998), Floyd (1987), Erin (1995), Nicole (2022), Dora (1964) and David (1979).
- Georgia to North Carolina: Hugo (1989), Hazel (1954), Gracie (1959), David (1979), Ian (2022), Matthew (2016), Florence (2018), Isaias (2020), Diana (1984), Ginger (1971), Connie (1955), Ione (1955), Irene (2011), Charley (2004), Fran (1996), Floyd (1999), Bertha (1996), Bonnie (1998), Dorian (2019), Isabel (2003), Arthur (2014), Gaston (2004), Charley (1986), Barbara (1953), Cindy (1959) and Bob (1985).
- Virginia to Maine: Gloria (1985), Belle (1976), Donna (1960), Carol (1954), Edna (1954), Bob (1991) and Gerda (1969).
Most of the remaining labels are numbered storms from 1851 to the late 1940s, spread along the same coasts. The map has no title on its axes and no printed data source.
What NOAA’s records add
Strongest landfalls. NOAA’s post-storm review upgraded Michael to Category 5 at its October 2018 landfall near Mexico Beach, Florida, with winds estimated at 160 mph. That made it the first Category 5 US landfall since Andrew in 1992 and only the fourth on record, after the 1935 Labor Day hurricane and Camille in 1969 [3]. The map shows exactly these four in purple.
Deadliest. The Galveston hurricane of 1900 reached the Texas coast as a Category 4 on 8 September. Storm tides of 8 to 15 feet covered Galveston Island and were largely responsible for about 8,000 deaths (estimates range from 6,000 to 12,000), the deadliest weather disaster in US history [4].
Where they hit. The National Hurricane Center counted 284 hurricanes affecting the US coast from Texas to Maine between 1851 and 2010. By state, Florida had 114, Texas 64, Louisiana 57 and North Carolina 51, and a single storm can count for more than one state [5]. NHC also notes a clustering of the deadliest tracks on the coasts of Texas, southeastern Louisiana, south Florida, North Carolina and New England [5], the same places where the map’s labels are thickest.
Notes on this infographic
- No data source. The map does not name the dataset behind its landfall points and categories, so we cannot say which edition of the records it follows.
- Handle. The signature prints “@FeragamoWx” with one r. The creator’s account, where he posted the map on 18 December 2024, is @FerragamoWx [1].
- Years. The title says 173 years, while 1851 to 2024 covers 174 hurricane seasons if both end years are counted.
- Category at landfall. Colours show strength where the storm crossed the coast, not peak strength at sea, and one storm can carry two colours. The 1935 Labor Day hurricane hit the Florida Keys as a Category 5 and came ashore again near Cedar Key as a Category 2 [4].
- Labels. Our list of named storms is read from small labels and may miss or misread a few; check the original post for the full detail [1].
Questions about US hurricane history
Which U.S. state has the most hurricanes?
Florida. In the National Hurricane Center’s count for 1851 to 2010, 114 hurricanes affected Florida, well ahead of Texas with 64 [5].
What are the worst hurricanes in U.S. history?
By deaths, the 1900 Galveston hurricane, with about 8,000 killed [4]. By strength at landfall, the four Category 5 storms: the 1935 Labor Day hurricane, Camille in 1969, Andrew in 1992 and Michael in 2018 [3].
Was Hurricane Michael a Category 5?
Yes, NOAA's post-storm review upgraded Michael to Category 5 at its October 2018 landfall near Mexico Beach, Florida, with winds estimated at 160 mph [3]. That made it the first Category 5 US landfall since Andrew in 1992 and only the fourth on record [3]. The map shows Michael with a purple Category 5 marker on the Florida Panhandle.
How many hurricanes have hit the US since 1851?
The National Hurricane Center counted 284 hurricanes affecting the US coast from Texas to Maine between 1851 and 2010 [5]. It notes a clustering of the deadliest tracks on the coasts of Texas, southeastern Louisiana, south Florida, North Carolina and New England [5], where the map's labels are thickest. The map itself prints no total and names no data source for its landfall points.
Sources
- Michael Ferragamo, post of the map on X (18 December 2024; text and image read via the fxtwitter mirror, 30 October 2026).
- Reddit r/MapPorn, 173 yrs of US hurricane strikes (repost of the same map, opened 30 October 2026).
- NOAA, Hurricane Michael upgraded to a Category 5 at time of U.S. landfall (19 April 2019).
- National Hurricane Center, Hurricane history (Galveston 1900, Labor Day 1935 and Camille 1969 entries).
- Blake, Landsea and Gibney, The deadliest, costliest, and most intense United States tropical cyclones from 1851 to 2010 (NOAA Technical Memorandum NWS NHC-6, 2011).
Last reviewed 30 October 2026