Which US metro areas cost the most to live in?
The San Francisco Bay Area, Boston and the New York area are the most expensive places to live in the United States. Using MIT’s living wage figures for 2024, a family of four with two working adults needed about $167,000 a year before tax to cover basic costs in the San Jose metro area, $165,000 in San Francisco and $160,000 in Boston. The cheapest large metros were in Texas: McAllen at about $87,000 and El Paso at $90,000 [1][2].
Those figures come from a map of all 110 US metro areas with more than 500,000 people, made by Reddit user TA-MajestyPalm, shown above. The average across those metros was $113,958, so a family in San Jose needed nearly twice what a family in McAllen did to cover the same basics [1].
What do HCOL, MCOL and LCOL mean?
COL stands for cost of living, and people describe places as high, medium or low cost of living areas: HCOL, MCOL and LCOL. Adding V for “very” gives VHCOL and VLCOL, and in the most expensive places people sometimes stack them, as in VVHCOL. There is no official definition. The terms are shorthand used in salary, personal finance and remote-work discussions to say whether a place is pricier or cheaper than average.
TA-MajestyPalm’s map gives them concrete bands relative to the $113,958 average [1]:
| Tier | Compared with average | Examples (living wage for a family of four) |
|---|---|---|
| VVVHCOL | 40% to 50% above | San Jose $167k, San Francisco $165k, Boston $160k |
| VVHCOL | 30% to 40% above | Bridgeport $159k, Honolulu $150k |
| VHCOL | 20% to 30% above | San Diego $144k, New York $143k, Seattle $142k, Denver $140k, Los Angeles $140k |
| HCOL | 10% to 20% above | Washington DC $135k, Minneapolis-St Paul $131k, Sacramento $131k, Providence $126k |
| MCOL | Within 10% either way | Philadelphia $124k, Chicago $121k, Phoenix $119k, Atlanta $115k, Austin $112k |
| LCOL | 10% to 20% below | Houston $102k, San Antonio $100k, Memphis $97k, New Orleans $96k |
| VLCOL | 20% to 30% below | El Paso $90k, McAllen $87k |
The map also puts Killeen, Texas ($96k) in the cheapest tier, although by its own bands $96k is about 16% below average, which is LCOL (our arithmetic).
Where living costs are high and low
The most expensive metros cluster in two places: coastal California, from the Bay Area to San Diego, and the Northeast corridor from Washington DC to Boston. Honolulu, Seattle, Portland in Oregon and Denver are the only other metros in the top three tiers, and Minneapolis-St Paul is the only Midwest metro above the middle band [1].
Most of the country sits in the middle. The MCOL band holds 61 of the 110 metros, including large Midwest metros such as Chicago, Detroit and Columbus, most of the Mountain West, Florida’s big cities, and Dallas and Austin [1]. The cheaper tiers are almost all in the South, from Houston and San Antonio to Memphis, New Orleans and Little Rock [1].
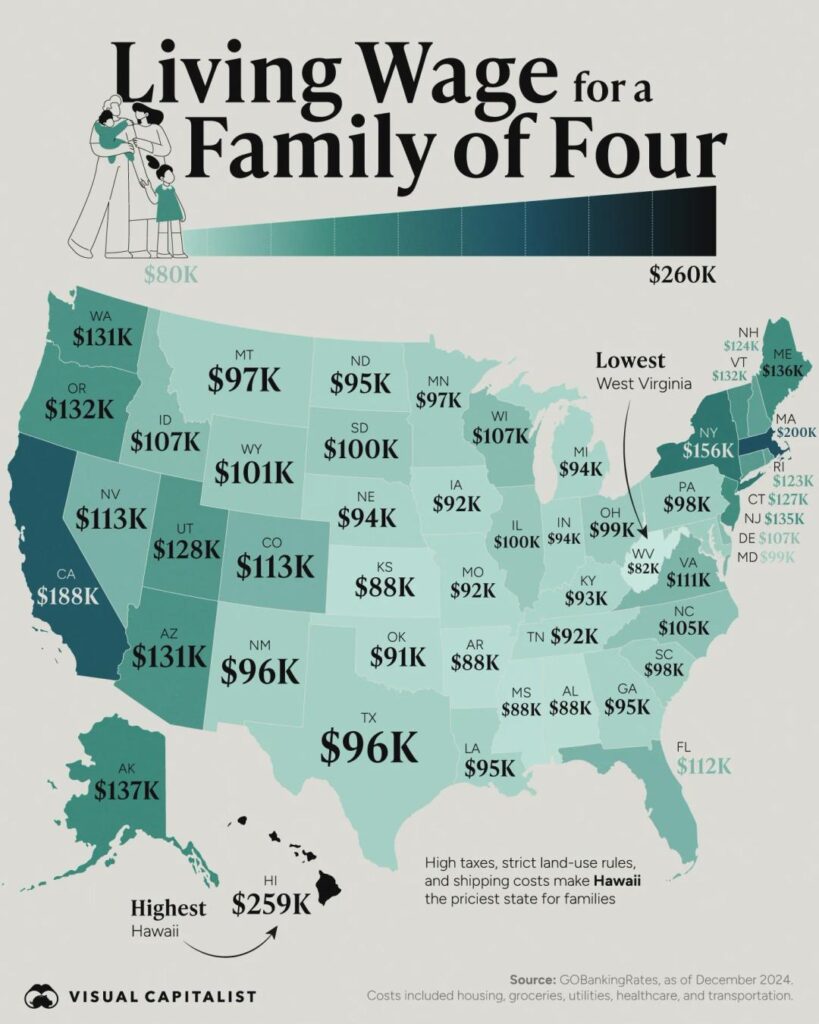
Official price data shows the same pattern at state level. The Bureau of Economic Analysis’s regional price parities, which compare price levels with the national average, put California (110.7), Hawaii (110.0) and New Jersey (108.8) highest in 2024, with Washington DC at 109.9. Arkansas (86.9), Mississippi (87.0), Iowa and Oklahoma (both 87.8) were the cheapest [3].
Why housing drives the difference
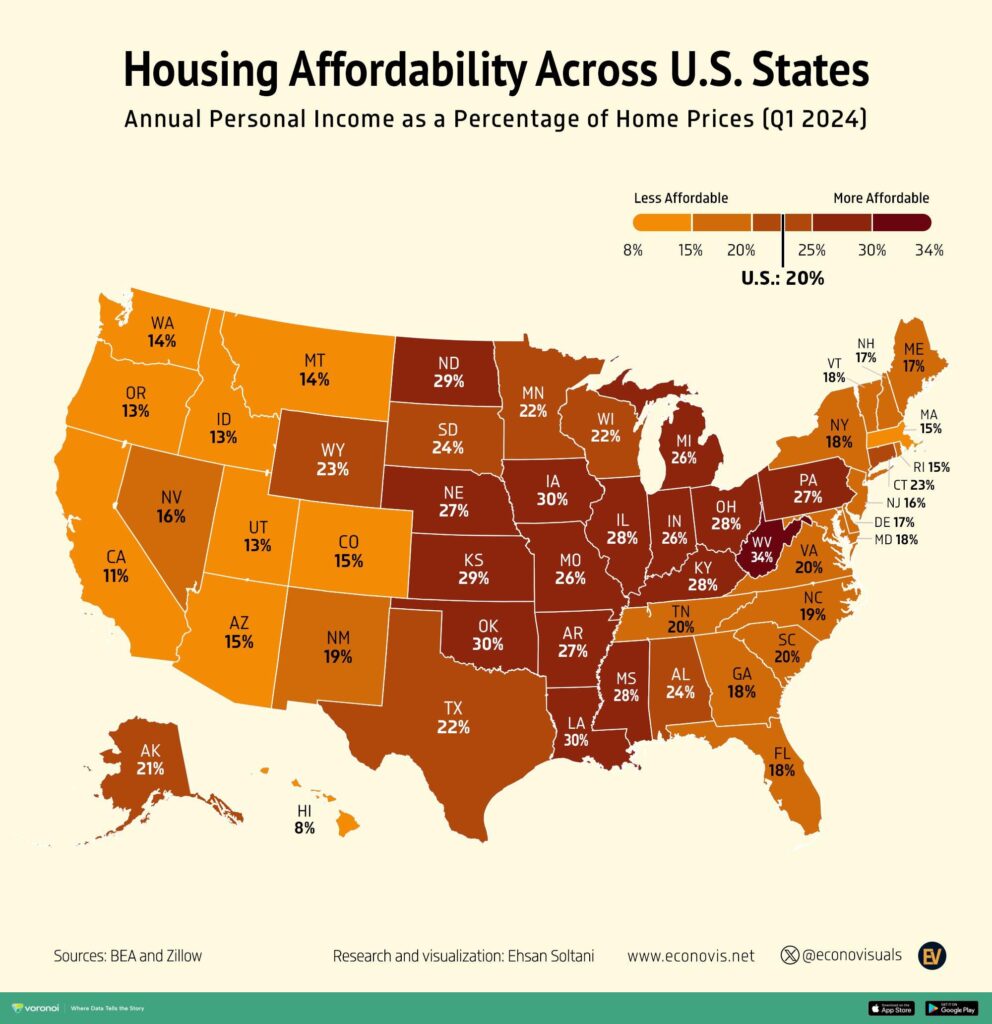
Housing is what separates expensive metros from cheap ones. Food, phones and clothing cost much the same across the country, but rent varies enormously. The BEA’s figures show this clearly: California’s price level for housing rents was 154.3, more than 50% above the national average, while West Virginia’s was 54.2, barely half of it [3]. Childcare and taxes, which also vary a lot by place, widen the gap further. That is why a family budget in San Jose can be nearly double one in McAllen while groceries cost only a little more.
How the living wage is calculated
The MIT Living Wage Calculator estimates what a full-time worker must earn to cover a family’s basic needs where they live, without public or private help [2]. It adds up eight components: food, childcare, health care, housing, transportation, civic engagement, broadband and mobile, and other necessities, plus income and payroll taxes [2]. For a family with two working adults, MIT splits the pre-tax budget between them and divides by 2,080 hours (40 hours a week for 52 weeks) to get an hourly wage [2].
The map uses the whole household budget before that split, which is why its figures run to six digits. A living wage is a bare minimum with no allowance for savings, holidays or eating out, so it is lower than what most people would call a comfortable income in the same place. MIT updates its figures every year; its current estimates are for 2026, in December 2025 dollars [2], so today’s numbers are higher than the 2024 ones on the map.
Questions about cost of living by metro area
What is the most expensive metro area to live in the US?
San Jose, California, where MIT’s 2024 living wage for a family of four with two earners was about $167,000, followed by San Francisco ($165k) and Boston ($160k) [1].
What is the cheapest large metro area in the US?
McAllen, Texas, at about $87,000 for the same family, followed by El Paso at $90,000 [1].
What is an LCOL area?
A low cost of living area, where everyday costs, especially housing, are well below the national average. On TA-MajestyPalm’s map, LCOL means 10% to 20% below the average metro, which covers places such as Houston, San Antonio, Memphis and New Orleans [1].
What does VHCOL mean?
Very high cost of living. On the map it covers metros 20% to 30% above average, such as New York, Seattle, Los Angeles and Denver [1].
Which state has the lowest cost of living?
Arkansas, with a 2024 regional price parity of 86.9, just ahead of Mississippi at 87.0 [3].
Sources
- u/TA-MajestyPalm, Cost of Living of US Metro Areas over 500k People (2024), r/MapPorn, 15 August 2024, the creator’s original post.
- MIT Living Wage Calculator, Methodology.
- US Bureau of Economic Analysis, Regional Price Parities by State and Metro Area.
Last reviewed 2 November 2026