Which states have the highest poverty rates?
The US Census Bureau’s American Community Survey, the main source for state poverty figures, put the national rate at 12.1% in 2024, with state rates ranging from 7.2% to 18.7% [2]. The highest were [2]:
| State | Poverty rate, 2024 | People in poverty |
|---|---|---|
| Louisiana | 18.7% | 835,000 |
| Mississippi | 17.8% | 508,000 |
| District of Columbia | 17.3% | 117,000 |
| West Virginia | 16.7% | 287,000 |
| New Mexico | 16.4% | 343,000 |
| Kentucky | 15.6% | 694,000 |
| Arkansas | 15.5% | 466,000 |
| Alabama | 15.2% | 761,000 |
| Oklahoma | 14.9% | 593,000 |
| New York | 14.0% | 2,705,000 |
People in poverty rounded to the nearest thousand. The Census Bureau notes that the rates for Louisiana, Mississippi and the District of Columbia are not statistically different from each other, so treat the top three as roughly level [2].
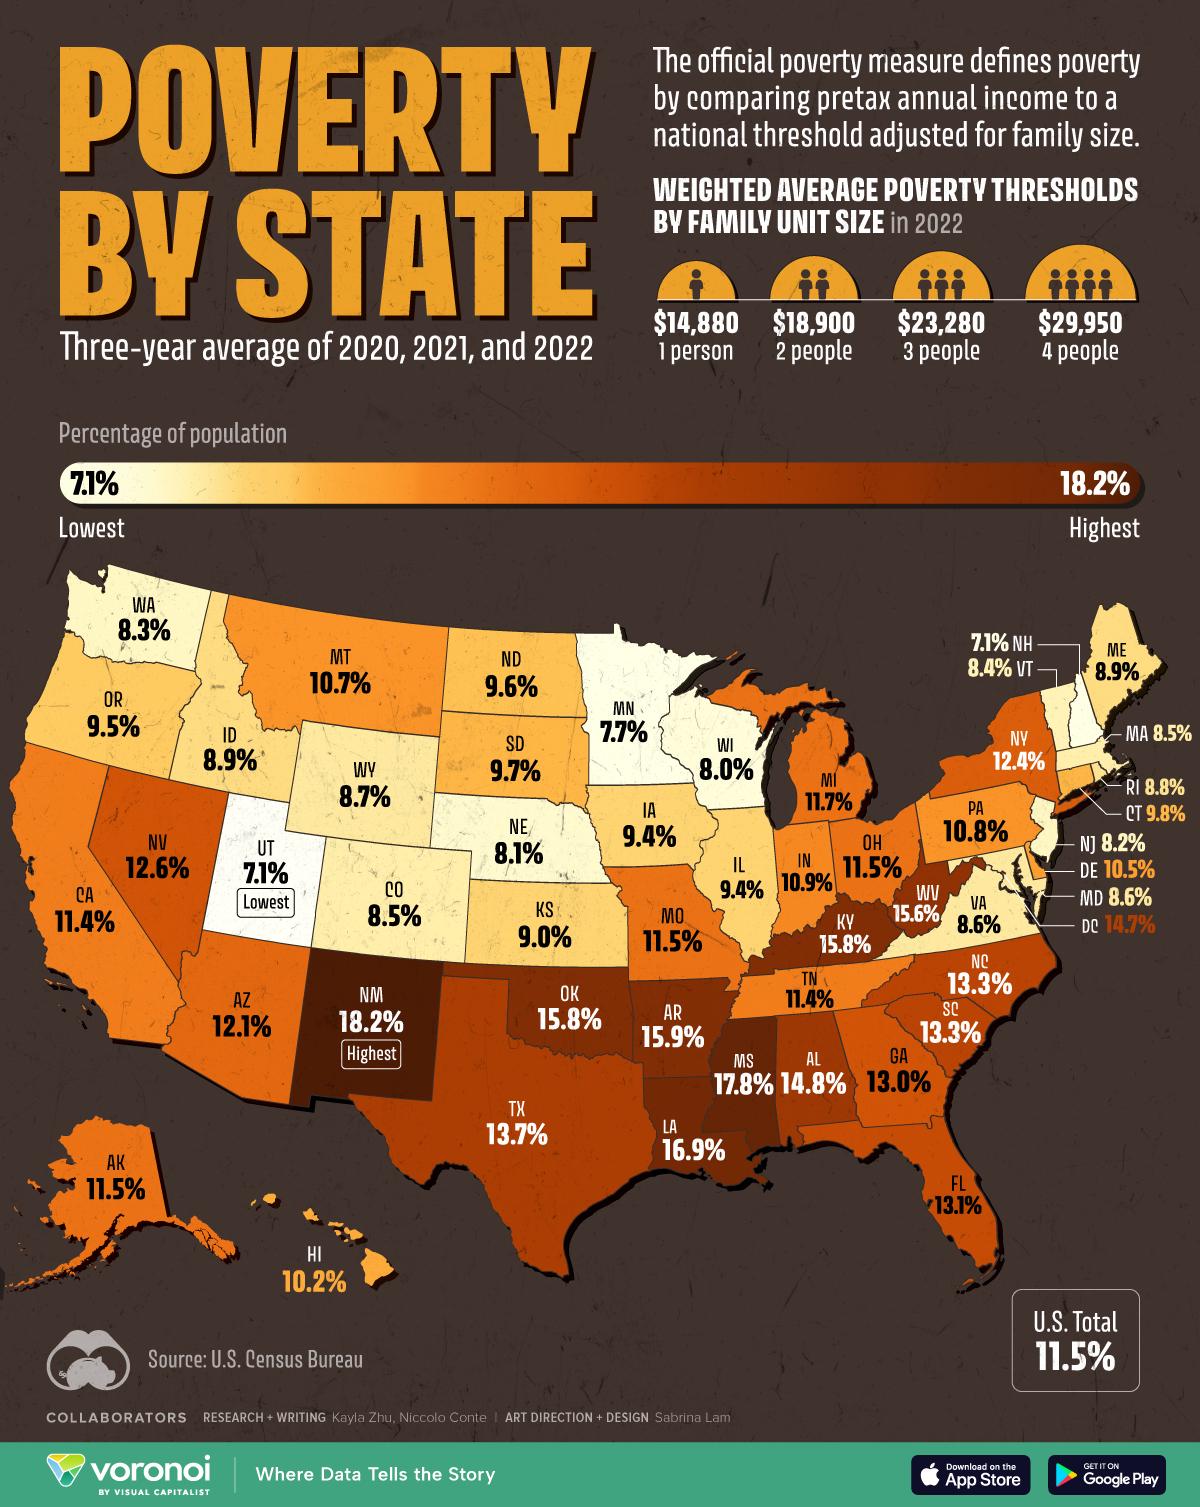
The Visual Capitalist map above, which averages 2020 to 2022, shows the same pattern: New Mexico was highest at 18.2%, followed by Mississippi at 17.8% and Louisiana at 16.9% [1]. New Mexico’s rate has since fallen, by 1.4 points between 2023 and 2024 alone [2].
Which states have the lowest poverty rates?
New Hampshire has the lowest rate, 7.2% in 2024 [2]. Utah (8.3%), Vermont (9.0%), Maryland (9.1%), New Jersey (9.2%) and Minnesota (9.3%) follow, and eleven states in total were below 10%: Colorado, Delaware, Maryland, Massachusetts, Minnesota, New Hampshire, New Jersey, Utah, Vermont, Virginia and Washington [2]. On the 2020 to 2022 averages in the map, Utah and New Hampshire tied for lowest at 7.1% [1].
Which states have the most people in poverty?
Rates and numbers tell different stories. Big states with middling rates have the most people in poverty: California had about 4.6 million people below the poverty line in 2024 and Texas about 4.1 million, followed by Florida (2.8 million) and New York (2.7 million) [2]. California’s rate of 11.8% is below the national average, but its population is so large that one in nine Americans in poverty lives there (our arithmetic).
Why poverty is highest in the South
Southern states dominate the top of the table. In 2024 nearly half of Southern states (six states plus the District of Columbia) had poverty rates of 15% or more, while 12 of the 13 Western states were in the two lowest bands [2]. Visual Capitalist points to the large rural areas of states such as New Mexico, Mississippi, Louisiana, Arkansas and Kentucky, which have historically been poorer than cities, along with lower levels of education and labour force participation. It adds that over 80% of the US counties with persistent poverty, above 20% for three decades, are in the South [1].
Costs matter too. The official poverty line is the same across the country, so it does not reflect how expensive it is to live in each state. A family just above the line in rural Mississippi is better off than one at the same income in California or New York. The Census Bureau’s Supplemental Poverty Measure adjusts for differences in housing costs and counts taxes and government support, so it can rank states quite differently from the official measure [3].
How the poverty rate is measured
The official measure compares a family’s income before tax with a poverty threshold that depends on family size [3]. For 2022, the year on the map, the average thresholds were $14,880 for one person, $18,900 for two, $23,280 for three and $29,950 for a family of four [1]. The thresholds are updated for inflation every year.
There are two Census sources, and they give slightly different figures. The national official rate comes from the Current Population Survey: it fell 0.5 points to 10.2% in 2025, with 34.5 million people in poverty, and child poverty fell to a historic low of 13.4% [3]. The Supplemental Poverty Measure, which counts taxes, tax credits and non-cash benefits, was 13.1% [3]. State rankings use the much larger American Community Survey, whose national rate is higher, 12.1% in 2024 [2].
Questions about poverty by state
What state has the highest poverty rate?
Louisiana, at 18.7% in 2024, closely followed by Mississippi at 17.8% [2].
What state has the lowest poverty rate?
New Hampshire, at 7.2% in 2024 [2].
What is the US poverty rate?
The official rate was 10.2% in 2025, or 34.5 million people [3].
What is the poverty line for a family of four?
The average Census threshold for a family of four was $29,950 in 2022 [1]. It rises with inflation each year, and the government’s separate poverty guidelines used for benefits differ slightly.
Is poverty falling in the US?
Yes, recently. The official rate fell in 2025, and between 2023 and 2024 state poverty rates fell in 13 states and rose in only one, North Dakota, plus the District of Columbia [2][3].
Sources
- Kayla Zhu, Visual Capitalist, Mapped, Poverty Rates by U.S. State, 15 August 2024, the original article for this map.
- US Census Bureau, Poverty in States and Metropolitan Areas: 2024, American Community Survey brief.
- US Census Bureau, Poverty in the United States: 2025 (P60-290), 15 September 2026.
Last reviewed 2 November 2026