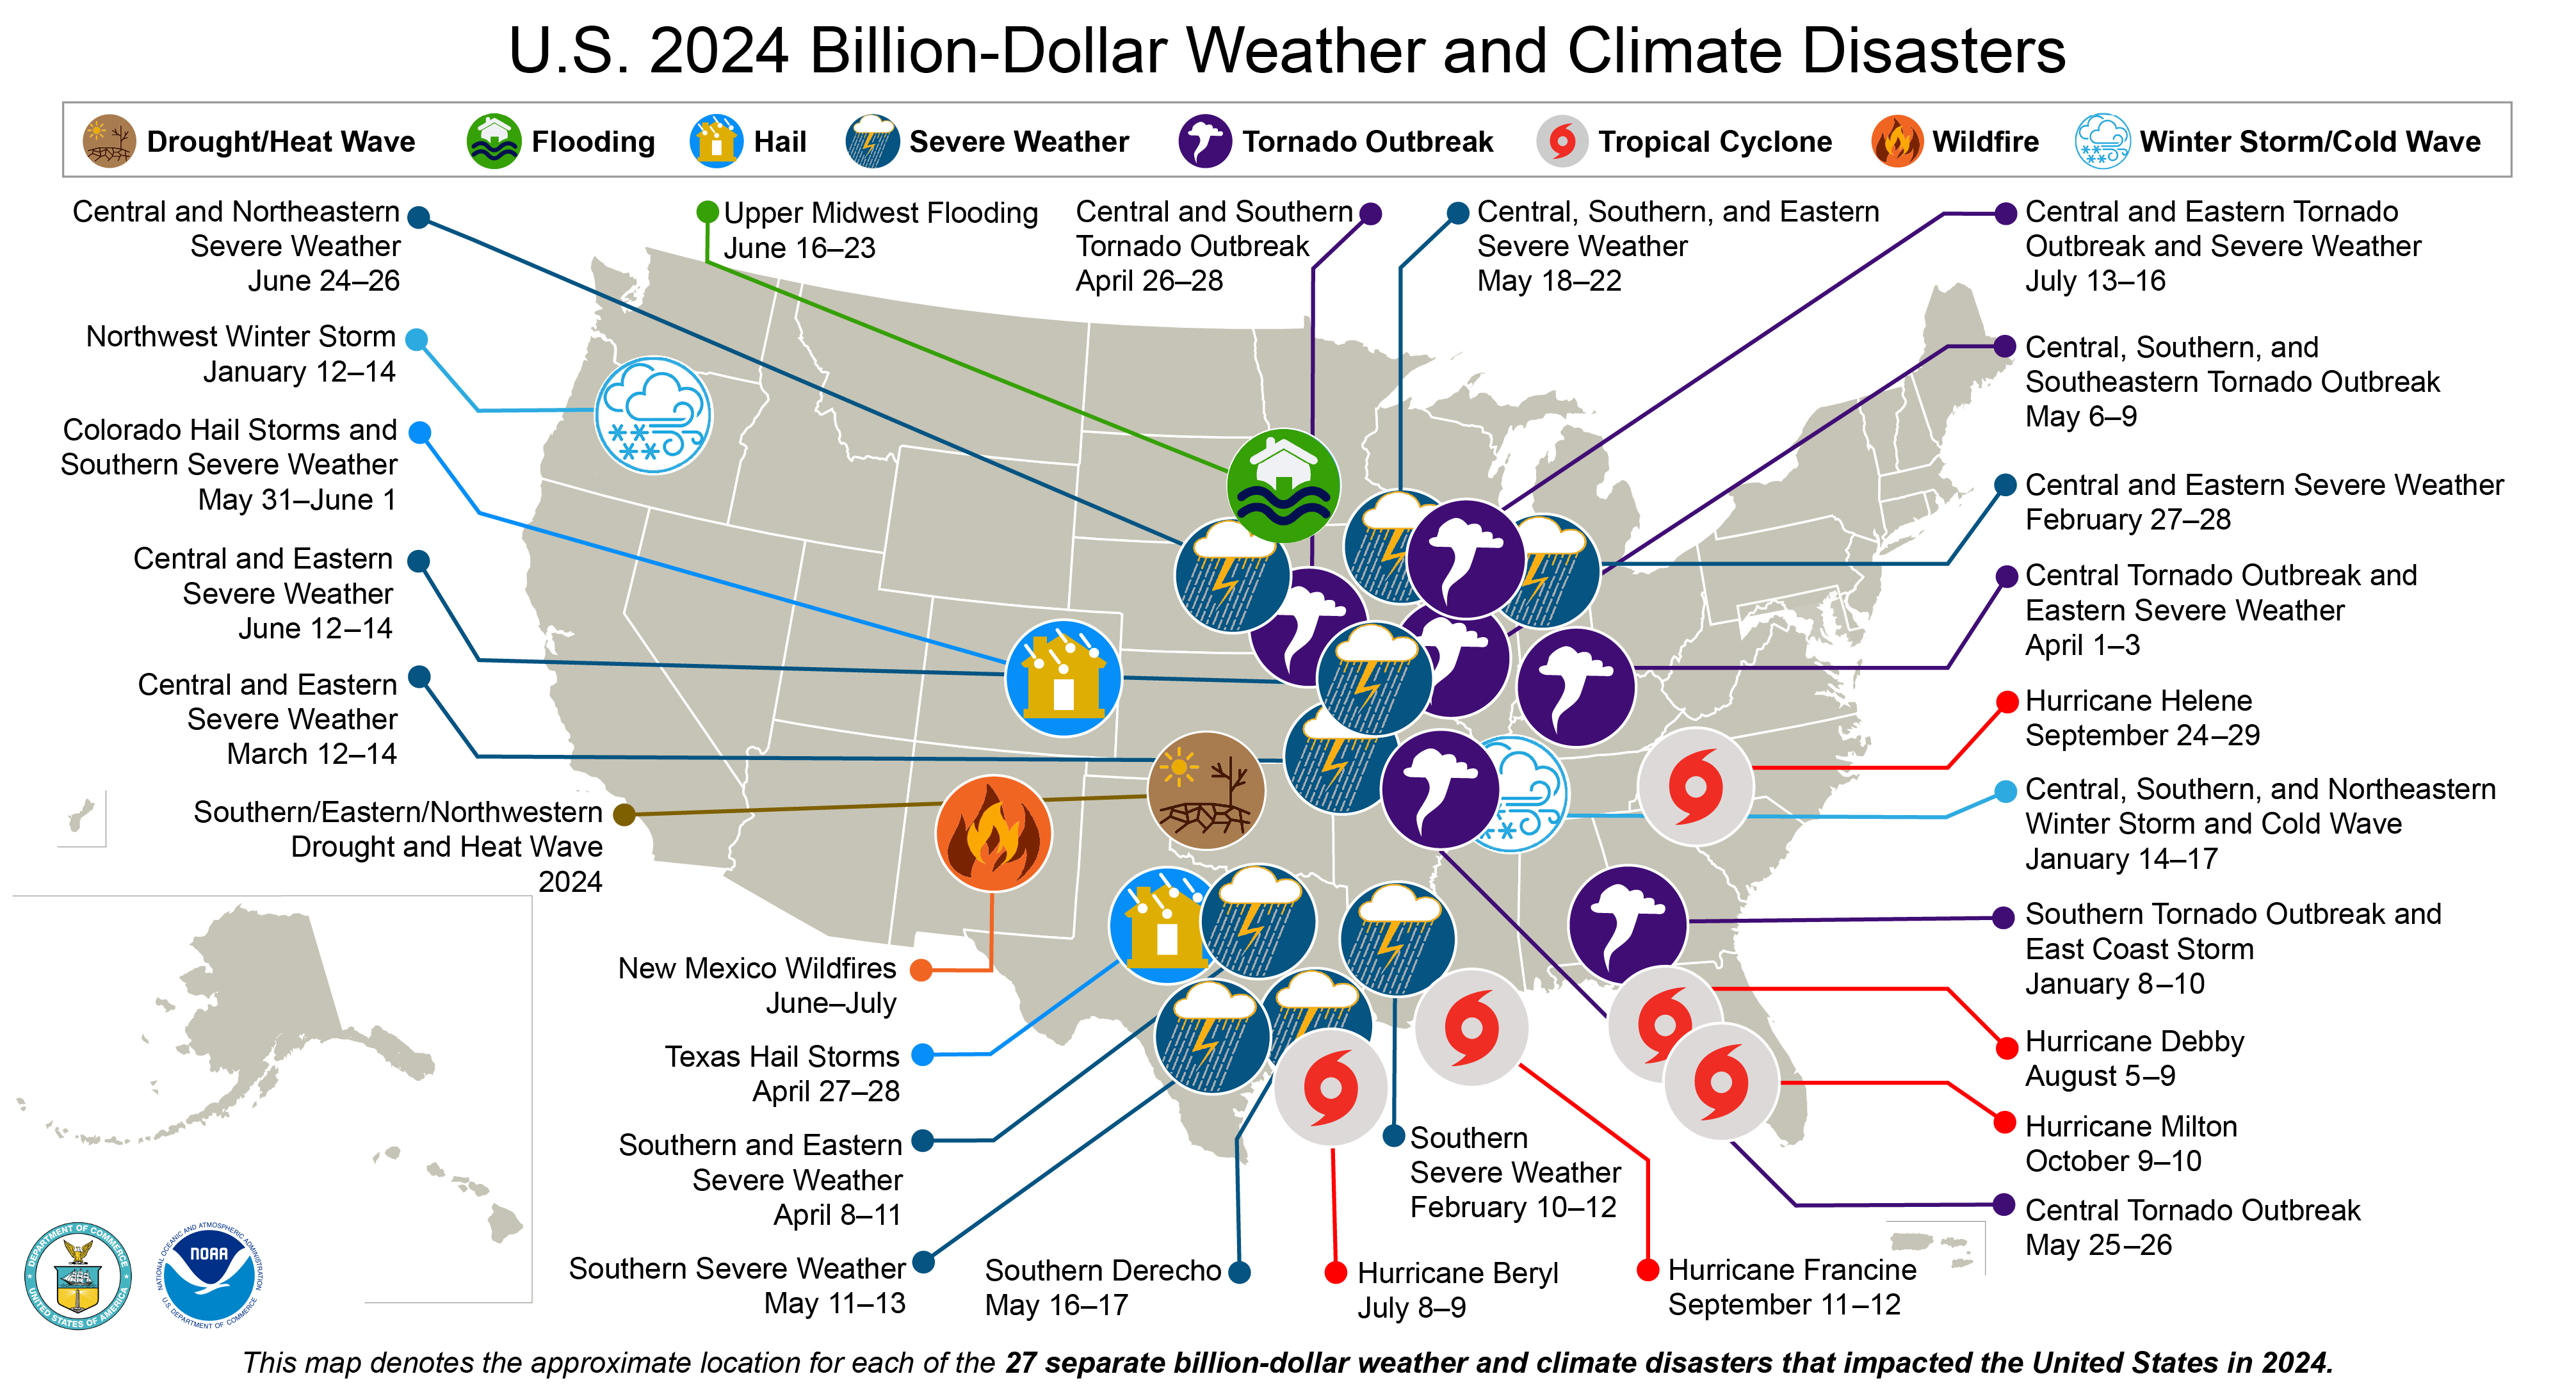
The US had 27 billion-dollar weather and climate disasters in 2024, one short of the record 28 in 2023. NOAA’s National Centers for Environmental Information (NCEI) put their combined cost at about $182.7 billion and counted at least 568 deaths. Hurricanes Helene and Milton were the two costliest, and severe storms, hail and tornado outbreaks made up 17 of the 27 events.
As the NCEI map shows, 2024’s disasters reached almost every part of the country, from hurricanes on the Gulf and Southeast coasts to hail across the Plains, a wildfire in New Mexico and a winter storm in the Northwest. This article covers what counts as a billion-dollar disaster, the costliest events of 2024, how the year compares with the record since 1980 and what has happened to the count since NOAA stopped updating it.
What counts as a billion-dollar disaster
A billion-dollar disaster is a single US weather or climate event whose total damage reached at least $1 billion once costs are adjusted for inflation. NCEI began the record in 1980 and adjusts every past event to current dollars with the Consumer Price Index, so a 1980s storm is compared with a recent one on the same basis.
NOAA describes the analysis as conservative in its 2024 summary on Climate.gov, because events below the threshold are left out. The same summary notes that 57 events since 1980 were originally under $1 billion but now count, because inflation has lifted them over the line.
Each event is filed under one of seven types, which are tropical cyclones, severe storms (tornadoes, hail and high winds), inland flooding, drought and heat waves, wildfires, winter storms and cold waves, and crop freezes.
How many billion-dollar disasters there were in 2024
There were 27, the second-highest count on record after 2023. According to NOAA’s 2024 summary, they broke down like this.
- 11 severe weather and hail events across many parts of the country
- 6 tornado outbreaks across the central and southeastern US
- 5 tropical cyclones, Beryl, Debby, Francine, Helene and Milton
- 2 winter storm and cold wave events in mid-January
- 1 drought and heat wave affecting the southern, eastern and northwestern US
- 1 flooding event in the Upper Midwest in June
- 1 wildfire, the South Fork Fire in New Mexico
NOAA’s figure of at least 568 deaths was the eighth-highest for any year in the record. It was also the 14th year in a row, from 2011, with ten or more billion-dollar disasters. The 1980 to 2023 average was 9.0 a year, while the five years from 2020 to 2024 averaged 23.0.
The costliest disasters of 2024
Hurricane Helene was the costliest and deadliest US disaster of 2024, followed by Hurricane Milton two weeks later. The table lists the five costliest events in NCEI’s billion-dollar disasters event data, in 2024 dollars.
| Event | Type | Dates | Cost | Deaths |
|---|---|---|---|---|
| Hurricane Helene | Tropical cyclone | 24 to 29 September | $78.7 billion | 219 |
| Hurricane Milton | Tropical cyclone | 9 to 10 October | $34.3 billion | 32 |
| Hurricane Beryl | Tropical cyclone | 8 July | $7.2 billion | 46 |
| Central, southern and southeastern tornado outbreak | Severe storm | 6 to 9 May | $6.6 billion | 3 |
| Central and southern severe weather | Severe storm | 12 to 14 March | $6.2 billion | 3 |
Helene made landfall near Perry, Florida, on 26 September as a Category 4 hurricane with 140 mph winds, the strongest on record to hit Florida’s Big Bend. NOAA reports up to 15 feet of storm surge on that coast, but the worst damage came inland, where up to 30 inches of rain or more caused historic flooding across western North Carolina, including Asheville. NOAA calls Helene the deadliest hurricane to strike the US mainland since Katrina in 2005.
Milton came ashore near Siesta Key, Florida, on 9 October as a Category 3 storm after reaching Category 5 strength over the Gulf. NOAA puts Helene and Milton together at more than $100 billion of damage across six states in about two weeks. Beryl hit Texas on 8 July as a Category 1 hurricane, and its power cuts left millions without electricity for days.
The May tornado outbreak produced more than 165 tornadoes in states from Nebraska and Michigan to Florida, including an EF-4 that hit Barnsdall and Bartlesville in Oklahoma.
How 2024 compares with other years
2024 was the fourth-costliest year since 1980. NOAA’s summary ranks it behind 2017 ($395.9 billion), 2005 ($268.5 billion) and 2022 ($183.6 billion), all three years with major hurricanes. Over the full record from 1980 to 2024, NCEI counted 403 billion-dollar disasters with a combined cost of more than $2.915 trillion.
The recent pace is far above the long-term average. NOAA’s figures show the five years from 2020 to 2024 cost $746.7 billion, an average of $149.3 billion a year, more than double the 45-year average of $64.8 billion a year. The ten years from 2015 to 2024 brought 190 separate billion-dollar disasters, more than 6,300 deaths and about $1.4 trillion in damage.
The costliest single disasters since 1980 are almost all hurricanes. These figures come from NCEI’s event data in 2024 dollars.
| Disaster | Year | Cost | Deaths |
|---|---|---|---|
| Hurricane Katrina | 2005 | $201.3 billion | 1,833 |
| Hurricane Harvey | 2017 | $160.0 billion | 89 |
| Hurricane Ian | 2022 | $119.6 billion | 152 |
| Hurricane Maria | 2017 | $115.2 billion | 2,981 |
| Hurricane Sandy | 2012 | $88.5 billion | 159 |
| Hurricane Ida | 2021 | $84.6 billion | 96 |
| Hurricane Helene | 2024 | $78.7 billion | 219 |
Which types of disaster cost the most
Tropical cyclones cost far more than any other type, while severe storms happen most often. According to NOAA’s breakdown for 1980 to 2024, tropical cyclones caused $1,543.2 billion of damage, at an average of $23.0 billion each, and 7,211 deaths.
Severe storms were the most frequent type, with 203 events costing $514.3 billion, but their average of $2.5 billion each is the lowest because they tend to hit smaller areas. Drought and heat waves cost $367.5 billion and were the second deadliest type, with 4,658 deaths. Inland flooding cost $203.0 billion across 45 events.
Why billion-dollar disasters are becoming more common
More people and more expensive property in risky places is the biggest driver, with climate change making some extremes more frequent or intense. NOAA points to three causes in its 2024 summary.
- Exposure, as homes and businesses keep spreading along coasts, river floodplains and the wildland edge in the West.
- Vulnerability, where building codes don’t do enough to limit damage from high winds, floods and fire.
- Climate change, which is raising the risk of drought, lengthening Western wildfire seasons, making very heavy rain more likely in the East and worsening storm surge as sea levels rise.
The cost per person has risen too, even after inflation. NOAA’s figures show the five-year average cost per US resident was about $150 in the early 2000s and rose above $400 in the late 2010s.
Billion-dollar disasters since NOAA stopped tracking them
NCEI no longer updates the dataset, so 2024 is the last year NOAA itself published. Its billion-dollar disasters page says the reports from 1980 to 2024 and their data remain authoritative and archived. Climate Central, an independent nonprofit, has continued the dataset with the same methods and the same lead scientist, Adam Smith.
Climate Central’s 2025 report counted 23 billion-dollar disasters in 2025, costing about $115.0 billion with 276 deaths. That was the third-highest count on record, behind 2023 and 2024. The Los Angeles wildfires in January 2025 cost $61.2 billion, the first time a wildfire was the costliest US disaster of a year, and 21 of the 23 events were severe storms. The same report found an average of just 16 days between billion-dollar disasters from 2016 to 2025, compared with 82 days in the 1980s.
Climate Central’s database put the running total at 453 events since 1980 as of September 2026, costing more than $3.2 trillion. Its figures are adjusted to newer dollars than NOAA’s, so they are a little higher for the same years. For example, it puts 2024 at $187.9 billion in 2025 dollars.
Questions about billion-dollar disasters
What are billion-dollar disasters?
They are US weather and climate events, such as hurricanes, tornado outbreaks, floods, droughts and wildfires, that each caused at least $1 billion of damage after adjusting for inflation. NOAA kept the record from 1980 to 2024 and Climate Central now continues it.
What was the biggest natural disaster in 2024?
In the US it was Hurricane Helene, which killed 219 people and caused $78.7 billion of damage, according to NCEI. Most of the deaths and damage came from flooding in western North Carolina rather than at the Florida coast.
How many billion-dollar disasters were there in 2025?
Climate Central counted 23 in 2025, costing about $115.0 billion. The Los Angeles wildfires were the costliest, and there were no landfalling hurricanes.
What are the biggest disasters in US history?
By cost since 1980, Hurricane Katrina in 2005 is the largest at $201.3 billion in 2024 dollars, followed by Hurricanes Harvey, Ian and Maria. By deaths in that period, Hurricane Maria in 2017 is the worst with 2,981, ahead of Katrina with 1,833.
Is NOAA still tracking billion-dollar disasters?
No. NCEI stopped updating the product after its 2024 analysis and keeps the 1980 to 2024 data archived. Climate Central took on the dataset and publishes the counts for 2025 onwards.
Sources
- NOAA Climate.gov, 2024, an active year of US billion-dollar weather and climate disasters (10 January 2025)
- NOAA National Centers for Environmental Information, Billion-Dollar Weather and Climate Disasters
- NOAA National Centers for Environmental Information, Billion-Dollar Weather and Climate Disasters events data, 1980 to 2024
- Climate Central, US billion-dollar weather and climate disasters in 2025 (9 March 2026)
- Climate Central, US Billion-Dollar Weather and Climate Disasters database
- NOAA National Centers for Environmental Information, US 2024 billion-dollar weather and climate disasters map