About 6.7% of US adults, or 16.3 million people, always or usually feel lonely, according to the U.S. Census Bureau’s September 2026 Household Pulse survey. Another 20.7% feel lonely some of the time. It is more common among adults aged 18 to 34 (12.9%), people who live alone (11.0%) and people on low incomes (14.3%), and it is linked to heart disease, stroke and early death.
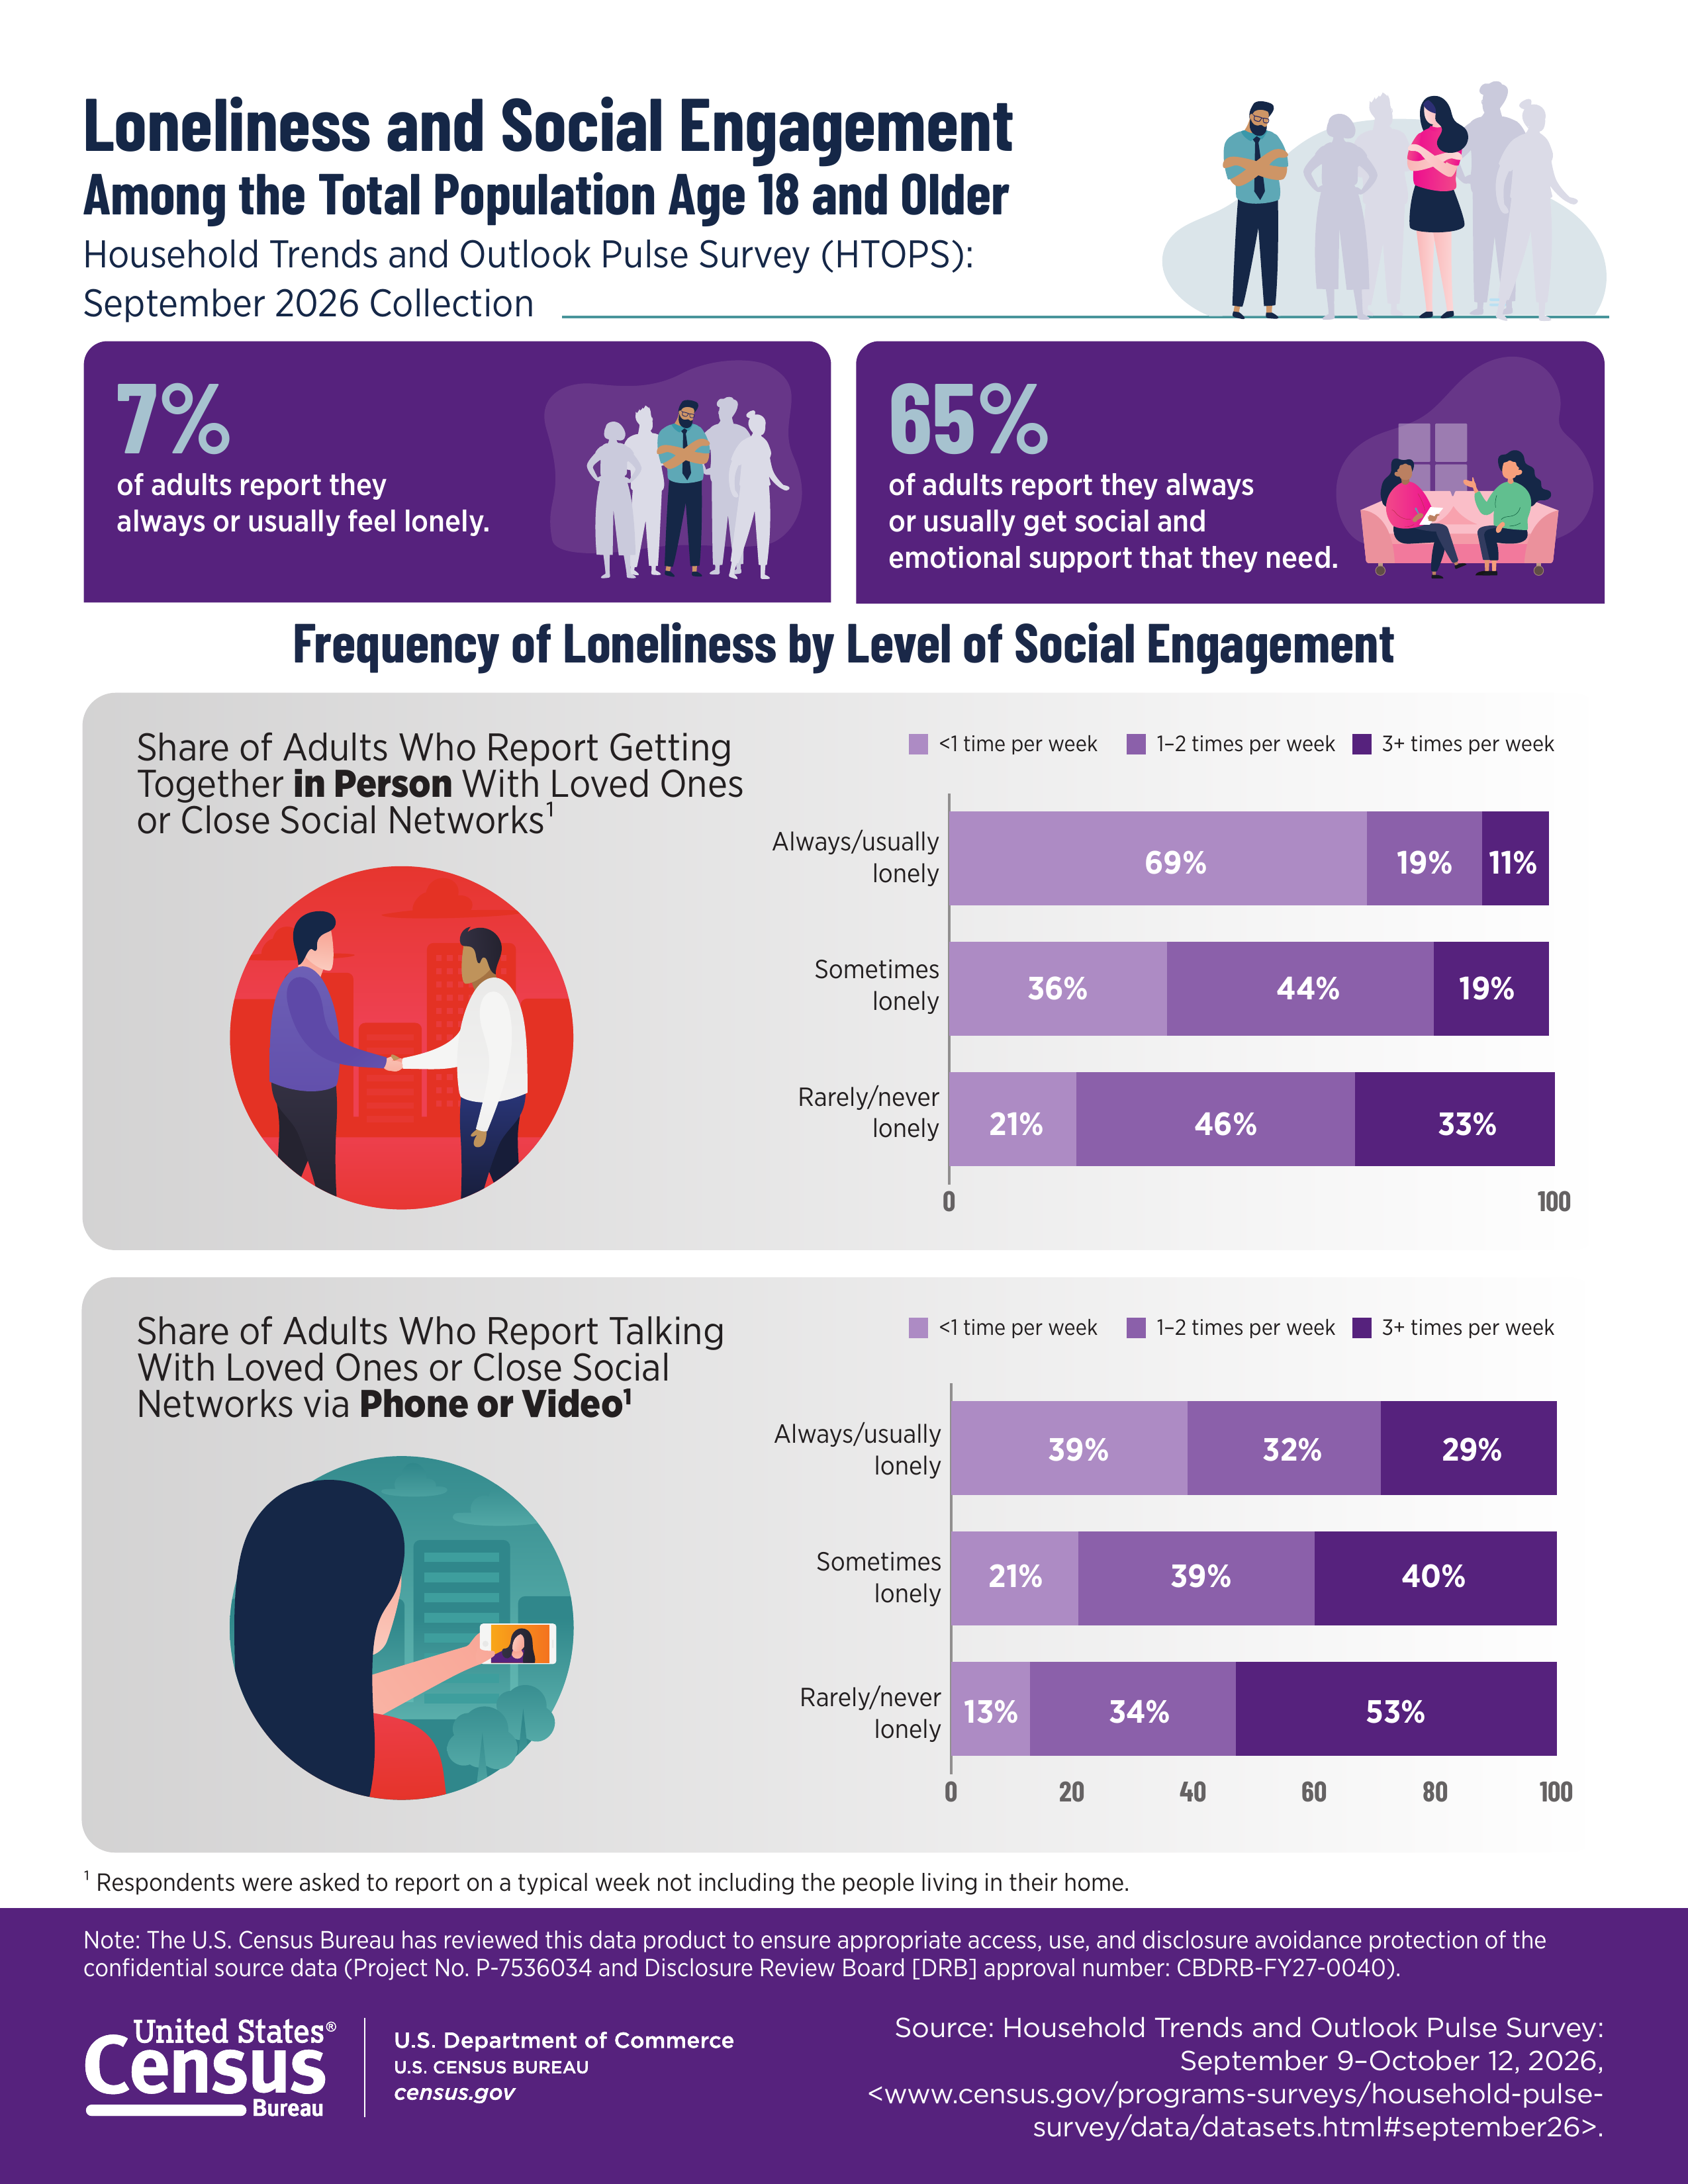
The figures come from the Census Bureau’s Household Trends and Outlook Pulse Survey, which asked US adults between 9 September and 12 October 2026 how often they feel lonely, how often they get the support they need and how often they see or talk to the people close to them. The infographic by the U.S. Census Bureau shown here takes the headline results from that collection and links them to how often people get together with loved ones. Below you’ll find how many Americans feel lonely, who is most affected, how loneliness ties in with contact and support, and what the health research says.
How many Americans feel lonely?
Around 1 in 15 American adults feel lonely most of the time, and just over a quarter feel lonely at least some of the time. In the September 2026 survey, 6.7% of adults who answered said they always or usually feel lonely, 20.7% said sometimes and 72.5% said rarely or never. The Census infographic rounds the first figure to 7%.
| How often adults feel lonely | Share of US adults, Sept 2026 |
|---|---|
| Always or usually | 6.7% |
| Sometimes | 20.7% |
| Rarely or never | 72.5% |
These shares are our calculation from the Census Bureau’s Health Table 3a, Feelings of Loneliness, and leave out the 18.3 million adults who didn’t answer the question, which is how the infographic’s 7% is worked out. The Census Bureau labels Household Pulse results as experimental data, so small changes between survey rounds can be noise. The same question gave 5.8% in the March 2026 collection and 9.0% in the July 2026 collection.
Why loneliness statistics vary so much
Loneliness figures differ mainly because surveys ask different questions. A survey that counts anyone who has felt lonely at all will find far more lonely people than one that counts only those who feel lonely always or usually.
The Census figure of 6.7% is the strict end of the scale. Add the people who feel lonely sometimes and it rises to 27.4%. The 2023 U.S. Surgeon General’s Advisory on loneliness and isolation said that in recent years about one in two adults in America reported experiencing loneliness, drawing on surveys that use wider measures. So when you see a headline saying a third or half of Americans are lonely, check what was asked and how often people had to feel lonely to be counted.
It also helps to know that loneliness and social isolation aren’t the same thing. The National Institute on Aging describes loneliness as the distressing feeling of being alone or separated, and social isolation as having few social contacts and few people to interact with regularly. You can live alone and not feel lonely, and you can feel lonely while surrounded by people.
Loneliness by age
Young adults are the loneliest age group in the US, and loneliness falls steadily with age. In the September 2026 Census survey, 12.9% of adults aged 18 to 34 always or usually felt lonely, more than five times the rate among people aged 65 and over (2.4%).
| Age | Always or usually lonely | Sometimes lonely | Rarely or never lonely |
|---|---|---|---|
| 18 to 34 | 12.9% | 29.3% | 57.8% |
| 35 to 49 | 6.4% | 18.6% | 75.0% |
| 50 to 64 | 4.1% | 17.8% | 78.1% |
| 65 and over | 2.4% | 15.9% | 81.7% |
Adults aged 18 to 34 make up about 28% of the adult population in the survey but 8.8 million of the 16.3 million adults who always or usually feel lonely, according to the Census table. The pattern isn’t only American. The World Health Organization’s Commission on Social Connection found that 17% to 21% of people aged 13 to 29 worldwide reported feeling lonely, with the highest rates among teenagers.
Older people aren’t free of the problem, though. The WHO estimates that social isolation affects up to 1 in 3 older adults, and the National Institute on Aging points to hearing and vision loss, poor mobility, bereavement and retirement as common reasons older people become cut off.
Who is most likely to feel lonely?
Apart from age, the biggest differences in the Census data are by relationship status, sexual orientation, income and whether someone has recently lost work. People who live alone are also more likely to feel lonely.
| Group | Always or usually lonely, Sept 2026 |
|---|---|
| All adults | 6.7% |
| Men | 5.6% |
| Women | 7.8% |
| Married | 2.9% |
| Widowed, divorced or separated | 9.6% |
| Never married | 13.0% |
| Living alone | 11.0% |
| Gay, lesbian, bisexual or uses a different term | 19.3% |
| Household income under $35,000 | 14.3% |
| Household income $150,000 and over | 1.7% |
| Household lost employment income in the last 4 weeks | 20.0% |
| High school education or less | 9.5% |
| Bachelor’s degree or higher | 4.0% |
All figures are shares of adults who answered, calculated from the Census Bureau’s loneliness table. A few things stand out. Adults on household incomes under $35,000 were more than eight times as likely to feel lonely most of the time as those on $150,000 or more. One in five adults in a household that had lost employment income in the previous four weeks always or usually felt lonely. And among people living alone, 11.0% felt lonely most of the time and another 37.6% felt lonely sometimes, so nearly half felt lonely at least some of the time.
Differences between US regions were small, from 5.6% in the South to 8.7% in the Midwest. With experimental survey data, gaps that size may not mean much.
How often Americans see and talk to loved ones
Most American adults see the people close to them in person at least once a week, but more than a quarter don’t. In the September 2026 survey, 27.5% of adults got together in person with loved ones or close friends less than once a week, not counting the people they live with, according to the Census Bureau’s social interaction table. Phone and video calls were more frequent, with 48.8% talking to loved ones that way three or more times a week.
The people who feel lonely most often are the ones who see others least. As the Census infographic shows, 69% of adults who always or usually feel lonely get together in person with loved ones less than once a week, compared with 21% of those who rarely or never feel lonely. Only 11% of the loneliest group meet in person three or more times a week, against 33% of the least lonely. The same pattern holds for calls, with 29% of the loneliest adults talking by phone or video three or more times a week, compared with 53% of those who rarely or never feel lonely.
That doesn’t prove that seeing people less causes loneliness. It works both ways, since people who feel low may also pull back from others. But the link is strong and it matches the wider research.
Older adults stay in touch more often than younger ones. In the Census data, 36.2% of people aged 65 and over got together in person with loved ones three or more times a week, against 24.9% of 18 to 34 year olds, and 57.1% talked by phone or video that often. Women were more likely than men to talk by phone or video three or more times a week (56.2% against 41.1%).
Social and emotional support
Nearly two thirds of American adults say they always or usually get the social and emotional support they need. In the September 2026 survey that share was 65.3%, which the infographic rounds to 65%, while 19.8% said they rarely or never get the support they need and 11.1% said never, according to the Census Bureau’s support table.
Support rises with age and income. Three quarters (74.9%) of adults aged 65 and over always or usually got the support they needed, against 60.9% of 18 to 34 year olds and 58.8% of people aged 35 to 49. Among adults with household incomes of $150,000 or more the figure was 78.1%, compared with 49.7% for incomes under $35,000. Men were more likely than women to say they never get the support they need (13.9% against 8.5%).
Community life and belonging
Many Americans have little regular contact with groups outside their home. In the 12 months before the September 2026 survey, 49.4% of adults hadn’t attended a religious service and 58.9% hadn’t been to a meeting of a club or organisation, according to the Census Bureau’s community engagement table. Young adults were the least likely to attend religious services, with 58.5% of 18 to 34 year olds going to none.
The Surgeon General’s advisory sets out how this has changed over time. Time spent with friends in person fell from 60 minutes a day in 2003 to 20 minutes a day in 2020, about 20 hours less a month. Single-person households made up 13% of US households in 1960 and 29% in 2022. And in 2020 only 47% of Americans said they belonged to a church, synagogue or mosque, down from 70% in 1999.
What is the loneliness epidemic?
The loneliness epidemic is the name given to the widespread loneliness and isolation that the U.S. Surgeon General, Dr Vivek Murthy, declared a public health concern in a 2023 advisory titled Our Epidemic of Loneliness and Isolation. The advisory argued that a lack of social connection harms health as much as some better known risks, and called for the same kind of national effort that has gone into tobacco use and obesity.
It set out six pillars for a national strategy, including stronger local social infrastructure such as parks, libraries and community programmes, policies that make connection easier, more attention to loneliness from health services, and changes to digital environments. In 2025 the WHO followed with its own global report from the Commission on Social Connection, which Dr Murthy co-chaired.
Health effects of loneliness
Loneliness and social isolation are linked to a higher risk of early death, heart disease, stroke, dementia and depression. The Surgeon General’s advisory says the mortality impact of being socially disconnected is similar to smoking up to 15 cigarettes a day.
- Early death. Loneliness raises the risk of premature death by 26% and social isolation by 29%, according to the advisory.
- Heart disease and stroke. Across 16 long-term studies, poor social relationships were linked to a 29% higher risk of heart disease and a 32% higher risk of stroke.
- Dementia. Chronic loneliness and social isolation can raise the risk of dementia in older adults by about 50%.
- Depression. People who are lonely are twice as likely to get depressed, according to the WHO, and loneliness is also linked to anxiety and thoughts of self-harm.
The National Institute on Aging adds high blood pressure, obesity and weaker immune function to the list, and notes that people who are lonely or isolated are more likely to end up in an emergency room or nursing home. Part of the reason is behaviour, since lonely people may exercise less, drink more, smoke and sleep badly. Part is the stress response, which over long periods can lead to chronic inflammation.
Loneliness around the world
About 1 in 6 people worldwide are affected by loneliness, according to the WHO Commission on Social Connection, which linked it to an estimated 871,000 deaths a year, around 100 every hour. Loneliness is twice as common in low-income countries (about 24%) as in high-income countries (about 11%).
The WHO lists poor health, low income and education, living alone, weak community infrastructure and digital technology among the causes. It also found that teenagers who felt lonely were 22% more likely to get lower grades or qualifications.
How to feel less lonely
Regular contact with other people is the most direct way to ease loneliness, and the Census data shows how closely the two go together. Small, regular steps tend to work better than waiting for a big change.
- Make a habit of seeing or calling someone you’re close to each week. The Surgeon General’s advice is simple. Answer that call from a friend, share a meal and listen without the distraction of your phone.
- Join something that meets regularly, such as a class, club, faith group or volunteering. The National Institute on Aging says people who take part in activities they enjoy with others feel a sense of purpose and tend to live longer.
- If you care for an older relative, the federal Eldercare Locator (800-677-1116) can point you to local support for older adults.
- If loneliness is affecting your mood or sleep, talk to your doctor. If you’re in distress, you can call or text 988 to reach the 988 Suicide and Crisis Lifeline, free and confidential, 24 hours a day.
Questions about loneliness
What percentage of Americans are lonely?
About 6.7% of US adults always or usually feel lonely and another 20.7% feel lonely sometimes, according to the Census Bureau’s September 2026 Household Pulse survey. That’s 27.4% who feel lonely at least some of the time. Surveys that count any experience of loneliness put the figure higher, at around one in two adults.
What age group is the loneliest?
Adults aged 18 to 34 are the loneliest age group in the US. In the September 2026 Census survey, 12.9% of them always or usually felt lonely, compared with 6.4% of people aged 35 to 49, 4.1% aged 50 to 64 and 2.4% aged 65 and over.
Is Gen Z considered the loneliest generation?
The data points that way. The Census survey doesn’t report by generation, but its youngest group, adults aged 18 to 34, which includes the adult members of Gen Z, has the highest loneliness rate of any age group at 12.9%. Worldwide, the WHO found the highest loneliness rates among teenagers.
What is the relationship between depression and loneliness?
Loneliness and depression often go together and each can make the other worse. The WHO says people who are lonely are twice as likely to get depressed, and the Surgeon General’s advisory lists depression and anxiety among the health effects of social disconnection.
Is loneliness as bad as smoking?
For risk of early death, the evidence suggests it can be. The Surgeon General’s advisory says the mortality impact of being socially disconnected is similar to smoking up to 15 cigarettes a day, and greater than that linked to obesity and physical inactivity.
What is the difference between loneliness and social isolation?
Loneliness is a feeling and social isolation is a situation. Loneliness is the distress of feeling alone or that your relationships fall short of what you want, while social isolation means having few social contacts. You can be isolated without feeling lonely, or lonely with plenty of people around you.
Who can I talk to if I feel alone?
Start with someone you trust, such as a friend, family member or your doctor. In the US you can also call or text 988 at any time to talk to a counsellor at the 988 Suicide and Crisis Lifeline, and older adults or their families can find local services through the Eldercare Locator on 800-677-1116.
The infographic shown here was created by the U.S. Census Bureau and, as a work of the US federal government, is in the public domain. Its use here does not imply endorsement by the Census Bureau, the U.S. Department of Commerce or the U.S. Government.
Sources
- U.S. Census Bureau, Loneliness and Social Engagement (12 November 2026)
- U.S. Census Bureau, September 2026 HTOPS Household Pulse data tables, Health Tables 3a, 3b, 3c and 3d
- U.S. Census Bureau, Household Pulse Health Table 3a for March 2026 and July 2026
- U.S. Census Bureau, Household Pulse Survey
- U.S. Department of Health and Human Services, Our Epidemic of Loneliness and Isolation, the U.S. Surgeon General’s Advisory on the Healing Effects of Social Connection and Community (2023)
- World Health Organization, Social connection linked to improved health and reduced risk of early death (30 June 2025)
- National Institute on Aging, Loneliness and Social Isolation, Tips for Staying Connected
- 988 Suicide and Crisis Lifeline
- Administration for Community Living, Eldercare Locator