What was the US median income in 2024?
US median income in 2024 was $83,730 for households, according to the Census Bureau. For individuals who worked full time all year, median earnings were $63,360, or $71,090 for men and $57,520 for women. The Bureau of Labor Statistics’ weekly pay survey gives a similar picture, with full-time employees earning a median of $1,192 a week at the end of 2024, about $62,000 a year.
Which figure you need depends on what you’re comparing. Household income adds together everyone in a home and counts all sources of money, not just pay. Individual earnings cover one person’s pay, and full-time figures leave out part-time workers, who pull the median down. Across all workers, full and part time, median earnings in 2024 were $51,370 [2]. The infographic by TA-MajestyPalm with this article breaks the full-time figure down by sex, age, education and race, using BLS data for the last three months of 2024 [1][3].
Median household income in 2024
Median household income was $83,730 in 2024, which the Census Bureau says was not statistically different from $82,690 in 2023 (in 2024 dollars) [2]. Half of US households had more than that and half had less.
| Household | Median income, 2024 |
|---|---|
| All households | $83,730 |
| Asian households | $121,700 |
| Non-Hispanic White households | $92,530 |
| Hispanic households | $70,950 |
| Black households | $56,020 |
Black households were the only group whose median income fell between 2023 and 2024, by 3.3%, while Asian and Hispanic household incomes rose by 5.1% and 5.5% [2]. The Census Bureau’s latest report, published in September 2026, puts median household income at $87,460 in 2025, the highest on record [4]. It also revises 2024 to $85,210, because that report is in 2025 dollars and uses updated population estimates [4].
Median income of full-time workers in 2024
A full-time worker in the US earned a median of $1,192 a week in the fourth quarter of 2024, according to the BLS [3]. That covers 120.3 million wage and salary workers who usually work 35 hours or more a week, and was 4.1% higher than a year earlier, ahead of 2.7% inflation [3]. Self-employed people are not included.
Multiplying weekly pay by 52 gives an annual figure of about $61,984. That is close to the Census Bureau’s $63,360 median for full-time, year-round workers in 2024, which counts people who worked at least 35 hours a week for 50 weeks or more [2][3]. The infographic uses the same method, weekly medians times 52, but its headline “All” figure of $64,368 is wrong. The BLS median of $1,192 a week gives $61,984 [3]. Its Associate’s or some college bar is also slightly out ($56,672, where $1,089 a week gives $56,628). Every other bar matches the BLS figures.
Median income by sex
Men working full time had median weekly earnings of $1,302 at the end of 2024, about $67,700 a year, and women $1,083, about $56,300 [3]. Women’s median pay was 83.2% of men’s [3].
The gap is smallest for young workers and widest for older ones. Women aged 16 to 24 earned 90.6% as much as men the same age, compared with 84.5% for those aged 25 to 54 and 76.7% for those aged 55 and over [3]. The Census Bureau’s annual figures show a bigger gap for 2024, with women’s median at 80.9% of men’s, the second fall in a row [2]. It narrowed to 83.9% in 2025, when women’s full-time median rose to $60,760 and men’s was $72,380 [4].
How full-time pay is spread
A quarter of full-time workers earned less than $805 a week at the end of 2024, about $41,900 a year, and a quarter earned more than $1,876 a week, about $97,600 [3]. The top 10% earned more than $2,884 a week, roughly $150,000 a year (our annual conversions) [3].
| Full-time workers, Q4 2024 | Weekly earnings | Annual (times 52) |
|---|---|---|
| Bottom 10% earned less than | $611 | $31,772 |
| Bottom 25% earned less than | $805 | $41,860 |
| Median | $1,192 | $61,984 |
| Top 25% earned more than | $1,876 | $97,552 |
| Top 10% earned more than | $2,884 | $149,968 |
The spread is wider for men than for women. The top 10% of men working full time earned more than $3,079 a week, against $2,503 for women [3].
Median income by age
Pay rises steeply through your twenties and early thirties, peaks between 35 and 54, then eases off. These are the BLS full-time medians for the fourth quarter of 2024, with our annual conversion [3].
| Age | Median weekly earnings | Annual (times 52) |
|---|---|---|
| 16 to 19 | $679 | $35,308 |
| 20 to 24 | $784 | $40,768 |
| 25 to 34 | $1,136 | $59,072 |
| 35 to 44 | $1,356 | $70,512 |
| 45 to 54 | $1,336 | $69,472 |
| 55 to 64 | $1,268 | $65,936 |
| 65 and over | $1,159 | $60,268 |
For men the peak runs from 35 to 64, at $1,442 to $1,488 a week, while women’s pay peaks at 35 to 54, at $1,193 to $1,205 [3].
Median income by education
Education makes the biggest difference of any group in the data. Full-time workers aged 25 and over with an advanced degree earned a median of $1,894 a week at the end of 2024, about 2.4 times the $776 of those without a high school diploma [3].
| Education (aged 25 and over) | Median weekly earnings | Annual (times 52) |
|---|---|---|
| No high school diploma | $776 | $40,352 |
| High school graduate | $977 | $50,804 |
| Some college or associate degree | $1,089 | $56,628 |
| Bachelor’s degree only | $1,547 | $80,444 |
| Advanced degree | $1,894 | $98,488 |
The jump from some college to a bachelor’s degree, about $458 a week or $23,800 a year, is bigger than the step from no diploma to some college [3]. These are medians, so plenty of people without degrees earn more than graduates.
Median income by race and ethnicity
Among full-time workers, Asian workers had the highest median weekly earnings at the end of 2024, $1,507, followed by White workers ($1,207), Black workers ($1,040) and Hispanic workers ($920) [3]. Hispanic people can be of any race, so they are also counted in the race groups [3].
The differences are larger for men than for women. Black men’s median was 84.6% of White men’s and Hispanic men’s 75.8%, while Black women earned 89.4% of White women’s median [3]. Asian men ($1,684) and Asian women ($1,367) both earned more than White men and women [3].
Median income since 2024
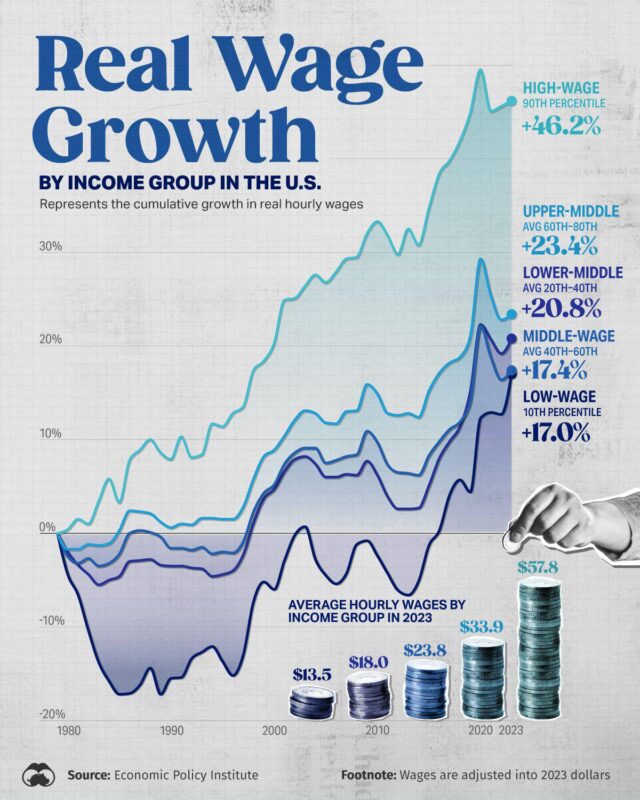
Pay has kept rising in cash terms but has recently fallen behind prices. In the third quarter of 2026 full-time workers earned a median of $1,232 a week, 1.5% more than a year earlier, while consumer prices rose 3.5% [5]. Men earned $1,352 a week and women $1,127, so women’s pay was 83.4% of men’s [5]. On the Census measure, 2025 was a better year, with full-time, year-round median earnings of $66,620 and household income at a record $87,460 [4].
If you want to compare your own pay with the top of the range rather than the middle, see our article on the income needed to join the top 1% in every US state.
Questions about US median income 2024
What is the median household income in the US in 2024?
$83,730, according to the Census Bureau’s 2025 report [2]. Its 2026 report revises this to $85,210 in 2025 dollars, and puts 2025 at $87,460 [4].
What is the median personal income in the US in 2024?
For full-time, year-round workers, $63,360 in 2024, and for all workers including part time, $51,370 [2]. The BLS median for full-time employees at the end of 2024 was $1,192 a week, about $61,984 a year [3].
What is the median income for men and women in the US?
For full-time, year-round workers in 2024, $71,090 for men and $57,520 for women [2]. On BLS weekly figures for the end of 2024, $1,302 a week for men and $1,083 for women [3].
What age group has the highest median income?
Full-time workers aged 35 to 44, at $1,356 a week in the fourth quarter of 2024, just ahead of 45 to 54 year olds at $1,336 [3].
What percentage of Americans make $40,000 a year?
Among full-time workers, roughly a quarter earn $40,000 a year or less. At the end of 2024 the bottom 25% of full-time employees earned under $805 a week, about $41,900 a year [3]. Counting part-time workers too, far more people earn under $40,000, as the median for all workers was $51,370 [2].
Sources
- TA-MajestyPalm, [OC] US Median Individual Wage by Characteristic (2024), r/dataisbeautiful, January 2025. This is the original post for the infographic.
- US Census Bureau, Income in the United States: 2024 (P60-286), September 2025.
- US Bureau of Labor Statistics, Usual Weekly Earnings of Wage and Salary Workers, Fourth Quarter 2024, 22 January 2025.
- US Census Bureau, Income in the United States: 2025 (P60-289), September 2026.
- US Bureau of Labor Statistics, Usual Weekly Earnings of Wage and Salary Workers, Third Quarter 2026, 21 October 2026.
Last reviewed 13 November 2026