Global wealth distribution is very uneven. UBS’s Global Wealth Report 2026 finds that the 1.5% of adults with more than $1 million own 48.4% of personal wealth, while the 42.1% with less than $10,000 own 0.6%. By region, North America holds 38.1% of the wealth and is home to 44.8% of the world’s dollar millionaires.
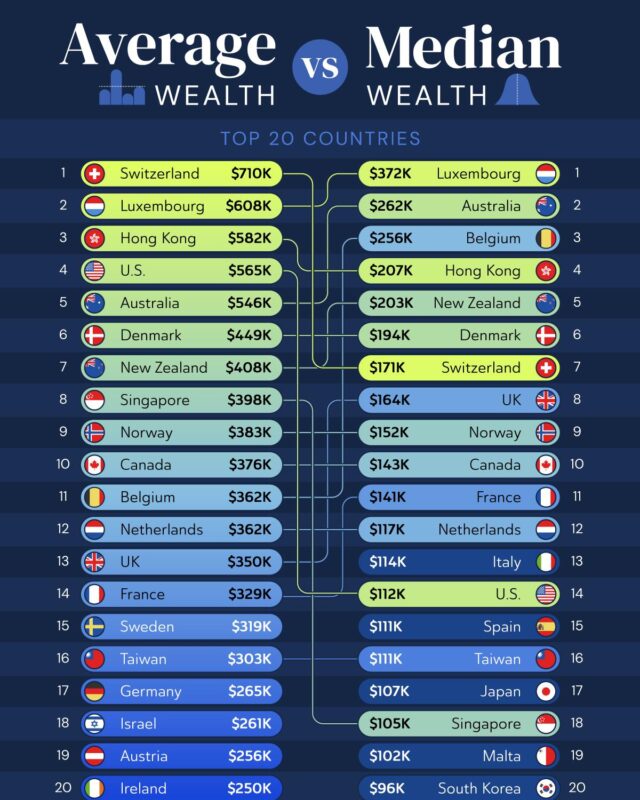
The Visual Capitalist infographic shown here uses UBS’s 2023 Global Wealth Databook to show which regions the adults in each wealth band live in [1]. This page covers how wealth is shared out between people and between regions, with the latest UBS figures for the end of 2025. For how average and typical wealth compare country by country, see our page on average wealth vs median wealth by country.
The global wealth pyramid
Most adults own very little, and a small group owns nearly half of everything. UBS sorts adults into four wealth bands, using net worth (assets minus debts) in US dollars at the end of 2025, across 56 markets that it estimates hold more than 92% of the world’s wealth [2].
| Wealth band | Adults | Share of adults | Wealth held | Share of wealth |
|---|---|---|---|---|
| Under $10,000 | 1.62 billion | 42.1% | $3.22 trillion | 0.6% |
| $10,000 to $100,000 | 1.58 billion | 41.1% | $63.16 trillion | 12.2% |
| $100,000 to $1 million | 588 million | 15.3% | $200.72 trillion | 38.8% |
| Over $1 million | 58 million | 1.5% | $250.59 trillion | 48.4% |
Source, UBS Global Wealth Report 2026, data for the end of 2025 [2].
The shape is changing. UBS says the lowest band has been shrinking since its records began in 2000 and the second band is now almost as large, so the bottom of the pyramid may soon be narrower than the level above it [2]. These are nominal dollar values, and UBS points out that growth is more muted after inflation [2].
Where the world’s wealth is by region
North America, Western Europe and Greater China hold nearly 80% of personal wealth between them. These are UBS’s shares of total wealth at the end of 2025 [2].
| Region | Share of global wealth | Share of USD millionaires |
|---|---|---|
| North America | 38.1% | 44.8% |
| Western Europe | 21.9% | 25.5% |
| Greater China | 18.5% | 11.7% |
| Southeast Asia | 11.5% | 9.9% |
| Eastern Europe | 3.3% | 1.8% |
| Australia and New Zealand (Oceania) | 2.8% | 3.3% |
| Latin America | 2.5% | 1.5% |
| Middle East and Africa | 1.4% | 1.5% |
Source, UBS Global Wealth Report 2026 [2]. UBS’s Southeast Asia group includes Japan, South Korea and India, and its Middle East and Africa figures cover only the markets in its sample.
The United States on its own holds 35.7% of the wealth in UBS’s sample [2]. Average wealth per adult ranged from about $43,000 in Latin America to more than $664,000 in North America at the end of 2025 [2].
Which regions the rich and the poor live in
Each region’s place in the wealth bands mirrors how developed its economy is. The UBS 2023 data used in the Visual Capitalist graphic shows that 42% of the world’s adults worth more than $1 million lived in North America and 27% in Europe, while Africa, India and the rest of Asia-Pacific together held 74% of adults with less than $10,000 [1].
| Region | Under $10,000 | $10,000 to $100,000 | $100,000 to $1 million | Over $1 million |
|---|---|---|---|---|
| Africa | 22% | 4% | 1% | 1% |
| Asia-Pacific (excluding China and India) | 28% | 19% | 20% | 17% |
| China | 8% | 40% | 25% | 11% |
| India | 24% | 12% | 3% | 1% |
| Europe | 6% | 12% | 27% | 27% |
| Latin America | 10% | 9% | 4% | 2% |
| North America | 2% | 5% | 19% | 42% |
Each column shows the share of the world’s adults in that band who live in each region, from the UBS Global Wealth Databook 2023 as charted by Visual Capitalist [1]. Columns may not add to exactly 100% because of rounding.
China is the clearest example of a middle wealth country. It had 40% of the world’s adults with $10,000 to $100,000, far more than any other region in any band [1]. Visual Capitalist links this to China’s move towards a service based economy, and notes that emerging markets such as India account for larger shares of the two lowest bands [1].
Keep in mind that these figures show where the people in each band live, not how much wealth each region holds. North America has only 2% of the world’s adults in the lowest band and 5% in the second, yet, as the table above shows, it holds close to 40% of the wealth [1][2].
How many millionaires are there in the world?
UBS counts roughly 57.5 million US dollar millionaires in its sample at the end of 2025, and more than 23.6 million of them, over 40%, live in the United States [2]. Nearly one million new millionaires were created in 2025, with the US adding more than 1,200 a day [2].
Western Europe has slightly fewer than 15 million millionaires, about 25% of the total. Mainland China has more than 5.3 million and Japan close to 3 million [2]. Luxembourg has the highest share of millionaires among its adults, close to one in six, and in the US about 9% of adults are dollar millionaires [2].
Is global wealth inequality getting worse?
By some measures, yes. UBS reports that personal wealth grew 10.8% in dollar terms in 2025, the third year of growth in a row, but median wealth fell in most markets, which it says points to a growing gap between the wealthiest and everyone else [2].
Over a longer period the picture is more mixed. More adults have moved out of the lowest band since 2000, and emerging markets’ share of global wealth rose from 8.4% in 2000 to a peak of 28.8% in 2022, before slipping to 26.2% in 2025 [2]. Part of the rise in 2025 came from a weaker dollar, which lifted the dollar value of wealth in Europe in particular [2].
Wealth is also far more unevenly spread than income, because it builds up over a lifetime and can be inherited. For a look at how that plays out within one country, see our page on US wealth by category from 1989 to 2024.
Questions about global wealth distribution
How is wealth distributed in the world?
Very unevenly. The 1.5% of adults worth more than $1 million own 48.4% of personal wealth, while the 42.1% with less than $10,000 own 0.6%, according to UBS’s figures for the end of 2025 [2]. By region, North America holds 38.1% of wealth, Western Europe 21.9% and Greater China 18.5% [2].
What percent of global wealth do millionaires hold?
Dollar millionaires held 48.4% of personal wealth at the end of 2025, about $250.6 trillion, according to UBS [2]. They were 58 million adults, 1.5% of the adults in UBS’s sample.
Where do most millionaires live?
North America, with 44.8% of the world’s dollar millionaires at the end of 2025, followed by Western Europe with 25.5% and Greater China with 11.7% [2]. In the 2023 data used for the infographic, North America’s share was 42% [1].
What is the global wealth pyramid?
It is UBS’s way of showing how many adults fall into each of four wealth bands, from under $10,000 at the base to over $1 million at the top. The base has always been the widest band, but UBS says it is shrinking and may soon be overtaken by the $10,000 to $100,000 band [2].
Sources
- Visual Capitalist, Charted, The Global Distribution of Wealth, by Region, by Marcus Lu, 27 December 2023, using the UBS Global Wealth Databook 2023.
- UBS, Global Wealth Report 2026, data for the end of 2025.