Environment and Energy
Germany Electricity Prices Compared With the Rest of the EU
That is the second highest in the EU after Ireland (39.2 cents) and about a third above the EU average of 28.8 cents.
489 reviewed infographics. Search them, or narrow the list by topic or type and sort it the way you want.
That is the second highest in the EU after Ireland (39.2 cents) and about a third above the EU average of 28.8 cents.
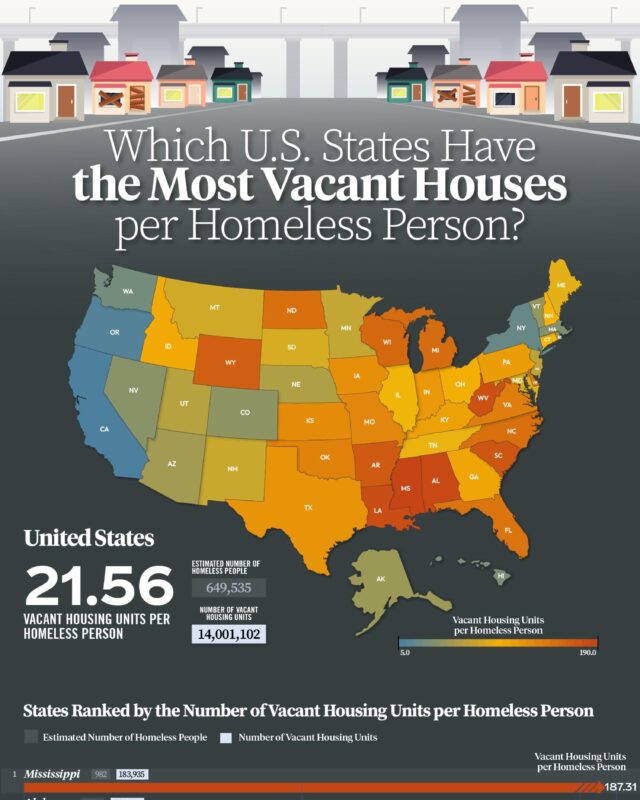
Census Bureau data shows about 14.0 million vacant housing units against 649,535 homeless people counted in January 2023, or about 21.6 vacant homes per…

In the first nine months of 2026 it was $131.5 billion.

On the Energy for Growth Hub's chart, income accounts for about 80% of the variation in electricity use between countries, and every country above $30,000…

Machinery and electronics make up almost half of China's $3.59 trillion of exports, while clothing, shoes and toys have shrunk from about a third in 2000 to…
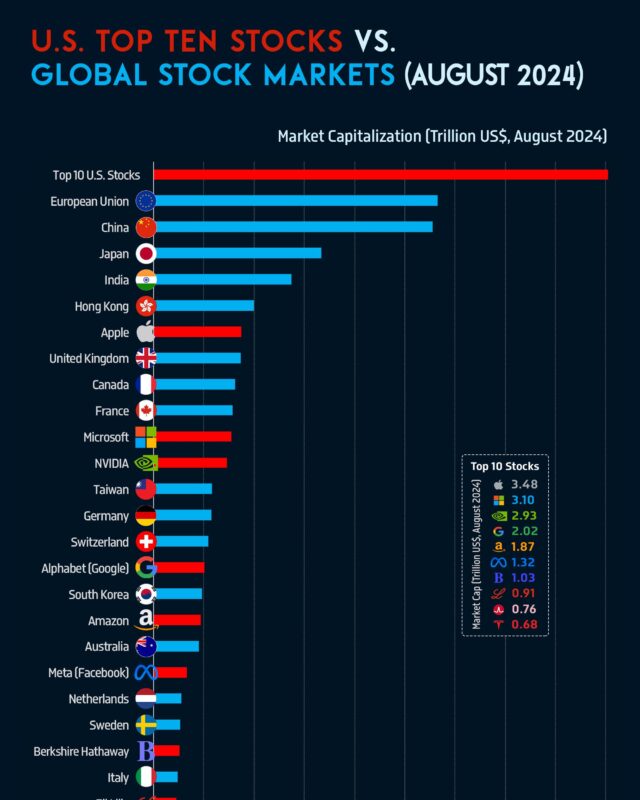
In August 2024 the ten largest US stocks were worth $18.1 trillion together, more than the whole stock market of the European Union or China.
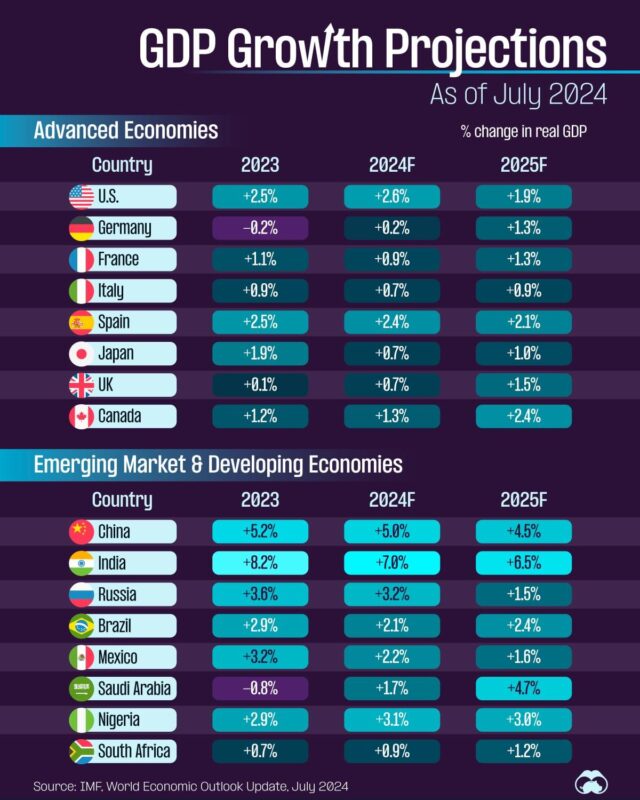
They produce about 40% of world output with 14% of its people, and usually grow more slowly than emerging markets: as of 2026 the IMF expects about 1.7% to…
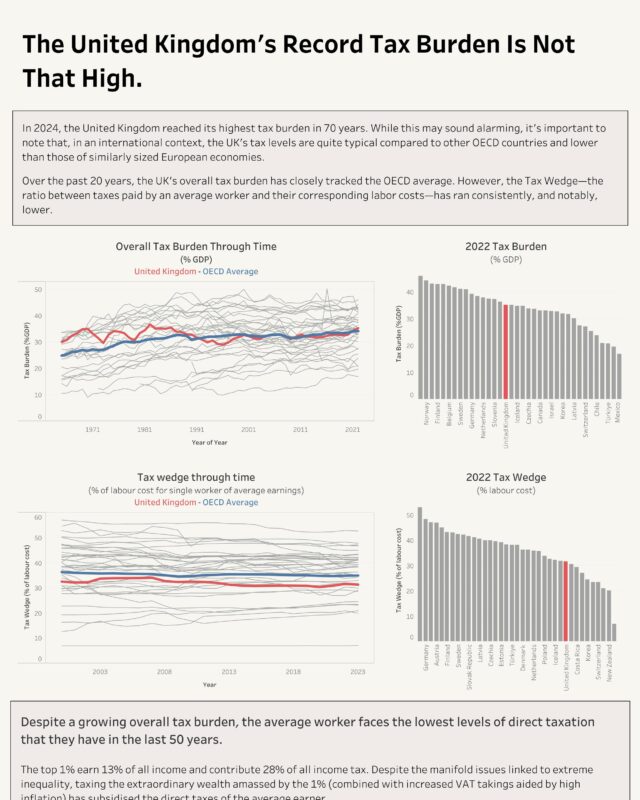
By the UK's own history it is high and rising: the OBR puts the tax take at 36.0% of GDP in 2025-26 and expects it to pass its historical high of 37.2% in…

On the 2026 list Amazon is first with $716.92 billion, just ahead of Walmart, then State Grid, UnitedHealth Group and Saudi Aramco.
Every topic page starts with a short guide to the subject.