

Football
Premier League Club Revenues
Manchester City (€829.3m), Arsenal (€821.7m) and Manchester United (€793.1m) were close behind.
This section covers association football, mostly the Premier League and other top European leagues, including squad values, club revenue, expected goals, player statistics and wage bills. Each page gives the full table as text and states the season it covers. Start with Premier League squad values, Premier League revenue by club, football player statistics across top leagues, non-penalty xG against goals or Ligue 1 wage bills by club. American football has its own NFL section. Club money, from revenue to wages, gets as much attention as results on the pitch.
Manchester City (€829.3m), Arsenal (€821.7m) and Manchester United (€793.1m) were close behind.

To compare players fairly, analysts convert them to per 90 minute rates and adjust for league strength.

In 2024/25 PSG paid €535m in wages, according to figures released by the DNCG, French football's financial regulator.

A penalty is worth a fixed 0.79 xG in Opta's model and 0.76 in Wyscout's, reflecting the share of penalties that have historically been scored.

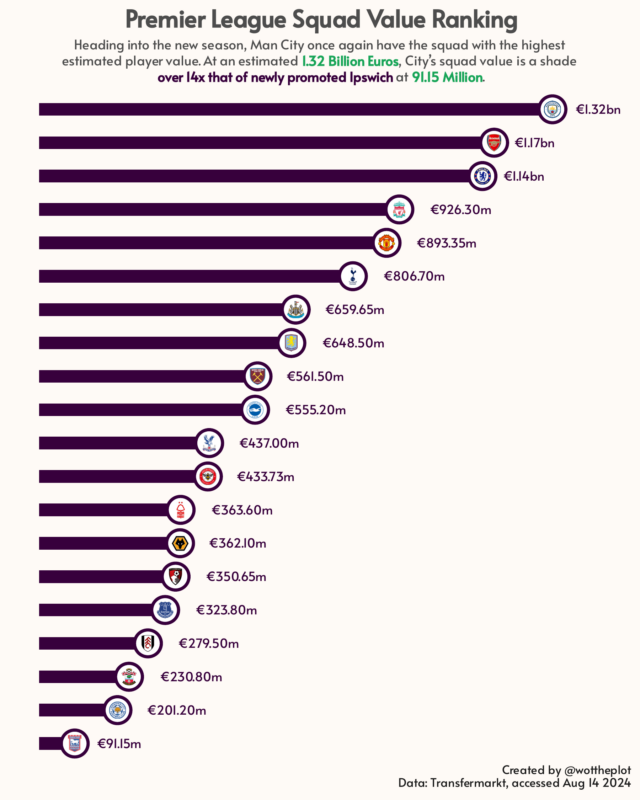
Transfermarkt valued it at €1.32 billion before the 2024/25 season, ahead of Arsenal at €1.17 billion and Chelsea at €1.14 billion, with newly promoted…
Give it a permanent page where people looking for your subject find it, with your name and a link to your site. Content marketers, agencies, designers and researchers all list here.