Key figures from the chart
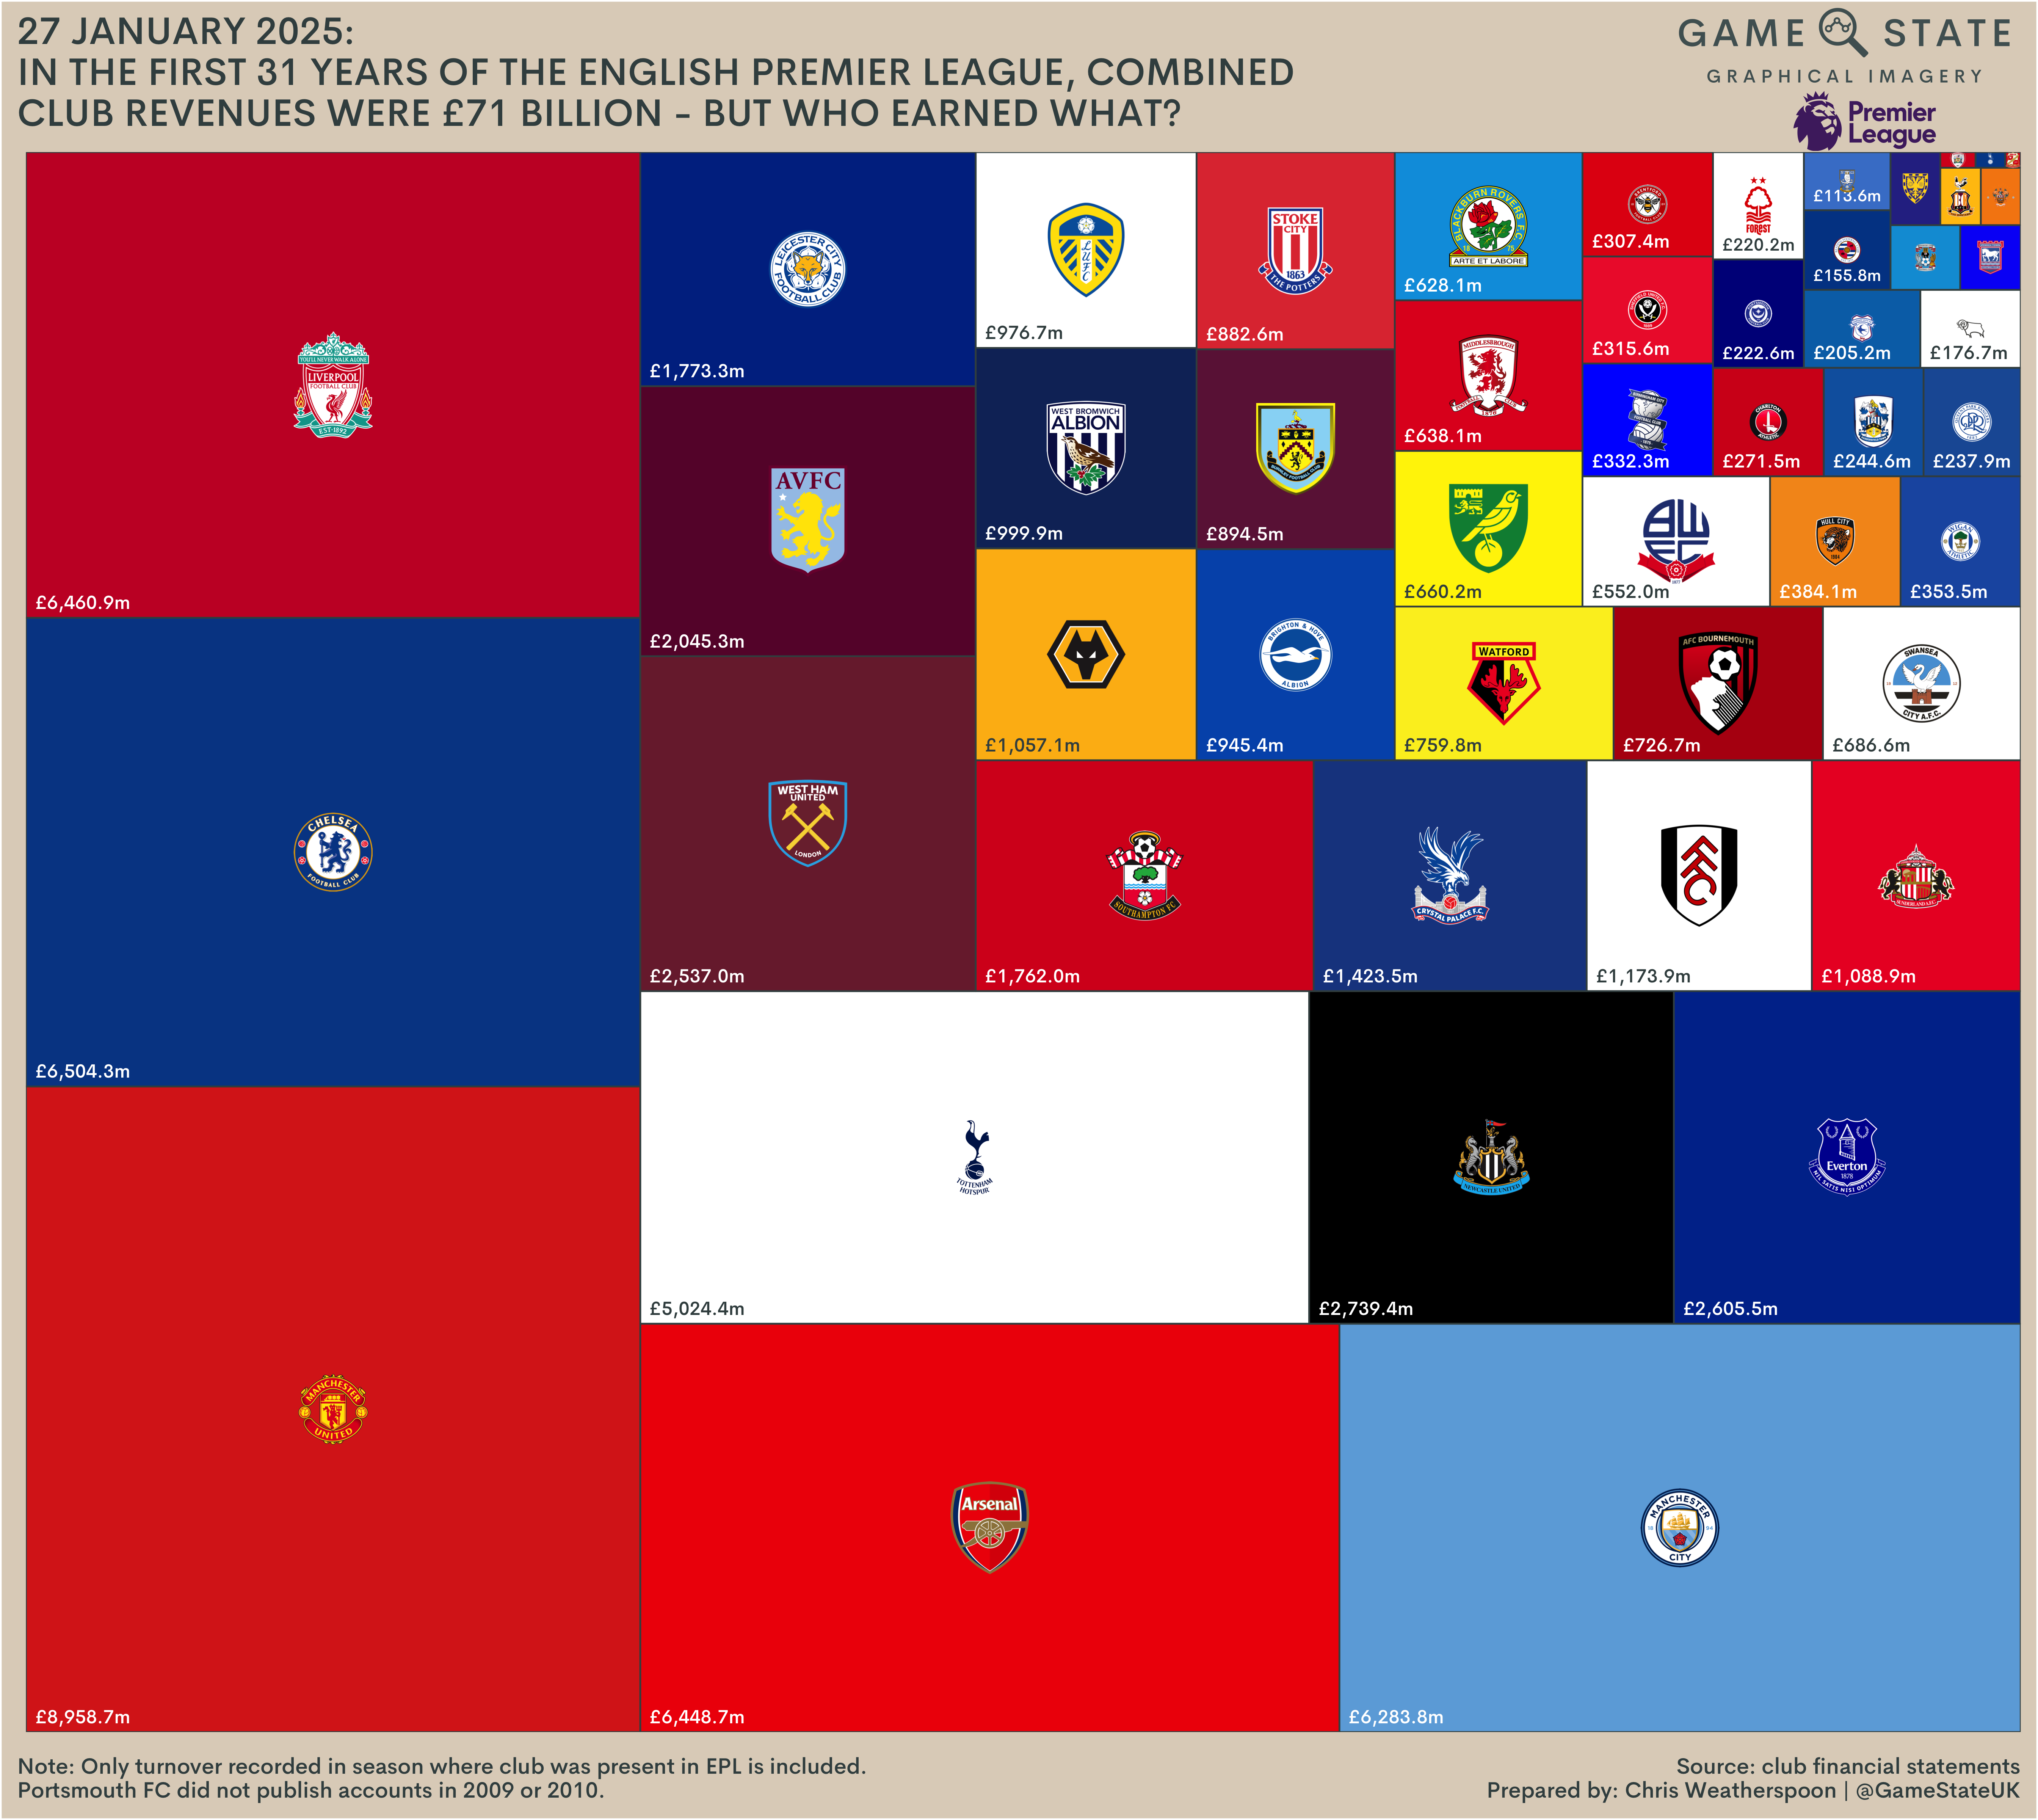
- Combined club revenue in the first 31 years of the Premier League was £71 billion, according to the chart.
- Manchester United earned the most, £8,958.7m, about 12.6% of the £71 billion (our arithmetic).
- Chelsea (£6,504.3m), Liverpool (£6,460.9m), Arsenal (£6,448.7m) and Manchester City (£6,283.8m) are close together in second to fifth place.
- The six clubs with more than £5 billion each earned £39.7 billion between them, about 56% of the total (our arithmetic).
- Newcastle United is seventh with £2,739.4m, roughly half of Tottenham’s £5,024.4m.
All figures are from the chart, which cites club financial statements.
Premier League revenue by club in text
The chart is a treemap: each club is a tile in its main colour, with its crest in the middle and its total revenue in the corner. Tile size is proportional to revenue. Club names are not written on the chart, so the names below are identified from the crests. Rank numbers are ours.
Title as printed: “27 January 2025: In the first 31 years of the English Premier League, combined club revenues were £71 billion, but who earned what?” (the chart uses a dash where we use a comma). Logos: Game State, “Graphical Imagery”, and the Premier League lion.
| Rank | Club (identified by crest) | Total revenue, first 31 seasons |
|---|---|---|
| 1 | Manchester United | £8,958.7m |
| 2 | Chelsea | £6,504.3m |
| 3 | Liverpool | £6,460.9m |
| 4 | Arsenal | £6,448.7m |
| 5 | Manchester City | £6,283.8m |
| 6 | Tottenham Hotspur | £5,024.4m |
| 7 | Newcastle United | £2,739.4m |
| 8 | Everton | £2,605.5m |
| 9 | West Ham United | £2,537.0m |
| 10 | Aston Villa | £2,045.3m |
| 11 | Leicester City | £1,773.3m |
| 12 | Southampton | £1,762.0m |
| 13 | Crystal Palace | £1,423.5m |
| 14 | Fulham | £1,173.9m |
| 15 | Sunderland | £1,088.9m |
| 16 | Wolverhampton Wanderers | £1,057.1m |
| 17 | West Bromwich Albion | £999.9m |
| 18 | Leeds United | £976.7m |
| 19 | Brighton and Hove Albion | £945.4m |
| 20 | Burnley | £894.5m |
| 21 | Stoke City | £882.6m |
| 22 | Watford | £759.8m |
| 23 | AFC Bournemouth | £726.7m |
| 24 | Swansea City | £686.6m |
| 25 | Norwich City | £660.2m |
| 26 | Middlesbrough | £638.1m |
| 27 | Blackburn Rovers | £628.1m |
| 28 | Bolton Wanderers | £552.0m |
| 29 | Hull City | £384.1m |
| 30 | Wigan Athletic | £353.5m |
| 31 | Birmingham City | £332.3m |
| 32 | Sheffield United | £315.6m |
| 33 | Brentford | £307.4m |
| 34 | Charlton Athletic | £271.5m |
| 35 | Huddersfield Town | £244.6m |
| 36 | Queens Park Rangers | £237.9m |
| 37 | Portsmouth | £222.6m |
| 38 | Nottingham Forest | £220.2m |
| 39 | Cardiff City | £205.2m |
| 40 | Derby County | £176.7m |
| 41 | Reading | £155.8m |
| 42 | Sheffield Wednesday | £113.6m |
About eight more tiles in the top right corner carry crests but no values. Notes as printed: “Only turnover recorded in season where club was present in EPL is included. Portsmouth FC did not publish accounts in 2009 or 2010.” Source as printed: “club financial statements”. Credit as printed: “Prepared by: Chris Weatherspoon | @GameStateUK”.
Which clubs are in the small tiles
Fifty-one clubs have played in the Premier League since it began in 1992 [1][2]. One of them, Luton Town, played its only Premier League season in 2023 to 2024 [1], after the 31 seasons on the chart, which leaves 50. The 42 labelled tiles account for 42 of those. Comparing the two lists, the eight clubs without a labelled tile are Barnsley, Blackpool, Bradford City, Coventry City, Ipswich Town, Oldham Athletic, Swindon Town and Wimbledon [1]. We could not read their crests well enough to match each one to a tile, so this is our inference from the club list.
The 42 labelled values add up to £70,778.3m, or about £70.8 billion (our arithmetic), so the unlabelled tiles and rounding make up the rest of the £71 billion.
Premier League revenue today
The chart counts every season since 1992, so the early seasons, when revenues were much smaller, sit beside recent ones. For a single season, Deloitte’s Annual Review of Football Finance put Premier League club revenue at £6.8 billion in 2024 to 2025, against £942m for the Championship [3]. The same review found that Premier League clubs’ combined pre-tax losses rose from £135 million in 2023 to 2024 to £948m in 2024 to 2025 [3].
Six clubs, Arsenal, Chelsea, Everton, Liverpool, Manchester United and Tottenham Hotspur, have played in every Premier League season [2]. Five of them are among the six largest tiles on the chart. Everton, eighth on the chart with £2,605.5m, is the exception.
Notes on this infographic
- Totals, not one season. Each figure is a club’s combined turnover across all its Premier League seasons from 1992 to 1993 onward, so clubs with long spells in the league rank higher.
- Portsmouth. The chart notes that Portsmouth did not publish accounts for 2009 or 2010, so its £222.6m excludes those years.
- Not adjusted for inflation. The chart does not say that figures are adjusted, so we assume they are cash amounts as reported.
- Creator. The chart is credited to Chris Weatherspoon of Game State (@GameStateUK) and dated 27 January 2025. We could not open the original post: X blocks automated access.
Questions about Premier League revenue
How much revenue does the Premier League generate?
Deloitte put Premier League club revenue at £6.8 billion for the 2024 to 2025 season [3]. Over the first 31 seasons combined, the chart puts it at £71 billion.
Which Premier League club generates the most revenue?
Over the first 31 seasons, Manchester United, with £8,958.7m on this chart. Chelsea is second with £6,504.3m.
How many teams are in the English Premier League?
Twenty clubs play in the Premier League each season, a number fixed since 1995 to 1996, and 51 clubs have played in it since 1992 [2].
Sources
- Wikipedia, List of Premier League clubs.
- Wikipedia, Premier League.
- ESPN, Premier League clubs’ pre-tax losses up over 600%, report, reporting Deloitte’s Annual Review of Football Finance.
Last reviewed 29 October 2026