
Science
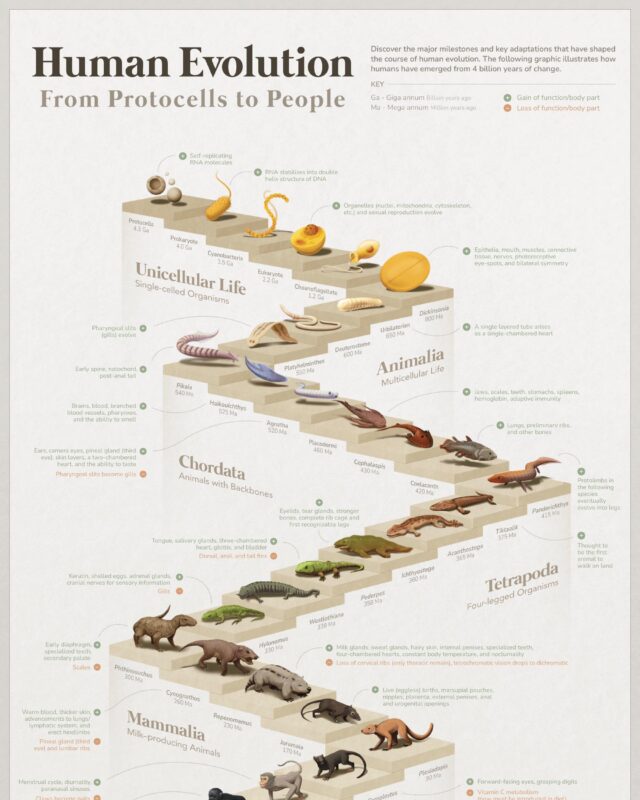
Human Evolution Timeline From Protocells to People
The human line split from the other African apes between 7 and 6 million years ago, upright walking evolved more than 4 million years ago, our genus Homo…

Infographic publisher
Visual Capitalist is an online publisher based in Vancouver, Canada, that has turned data into visual stories since 2011. You will find charts, maps and infographics on markets, technology, energy, demographics and the global economy. It has published more than 5,000 visuals, and also runs the Voronoi data app and the Elements site on natural resources.
The human line split from the other African apes between 7 and 6 million years ago, upright walking evolved more than 4 million years ago, our genus Homo…
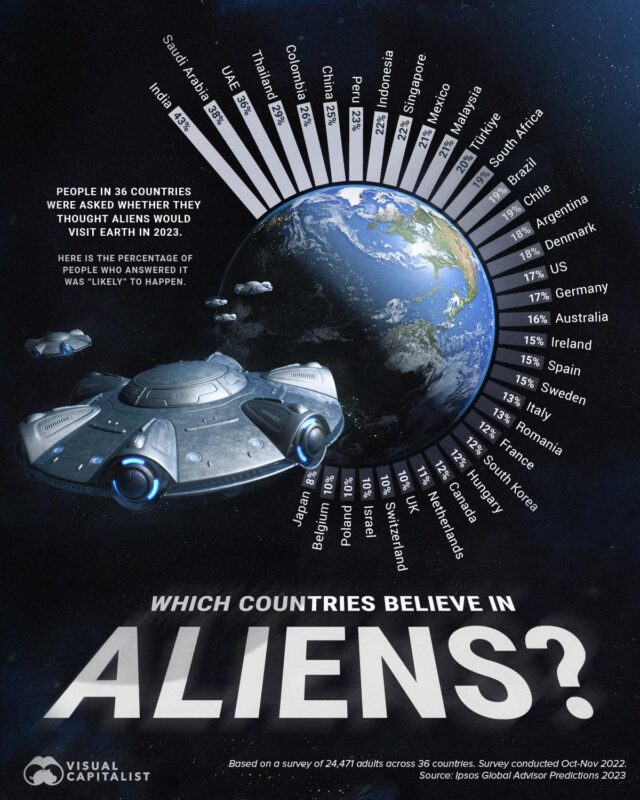
In an Ipsos survey of 36 countries, 43% of Indians said an alien visit in 2023 was likely, against a global average of 18%.
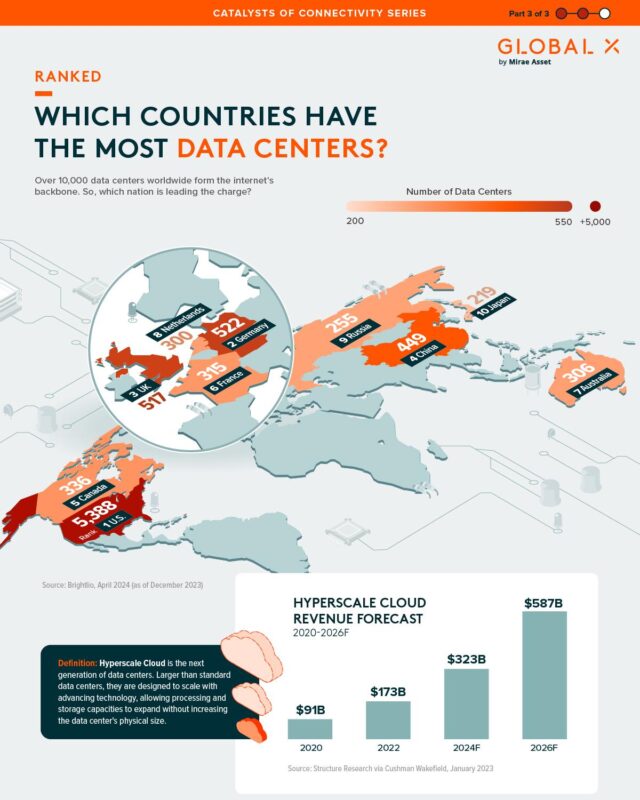
Germany (529), the United Kingdom (523), China (449) and Canada (337) follow.

In 2025 the median household in Massachusetts had $118,500 a year, about twice the $57,840 in Mississippi, against a US median of $87,460.

This Visual Capitalist map shows the 2024 figures, when the range was $178K to $301K.

This infographic by Dorothy Neufeld of Visual Capitalist shows all 20 risks from the Global Risks Report 2024.

Microsoft (140) and Cisco (134) come next, while Salesforce spent the most at $61.5 billion on just 63 deals.
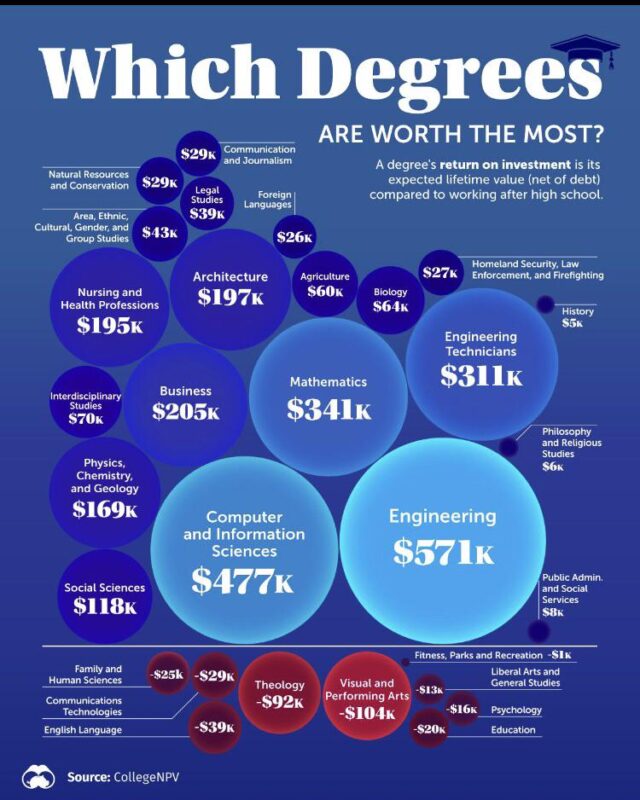
Nine fields, led by visual and performing arts (minus $104,000) and theology (minus $92,000), leave the typical student worse off than going straight into work.
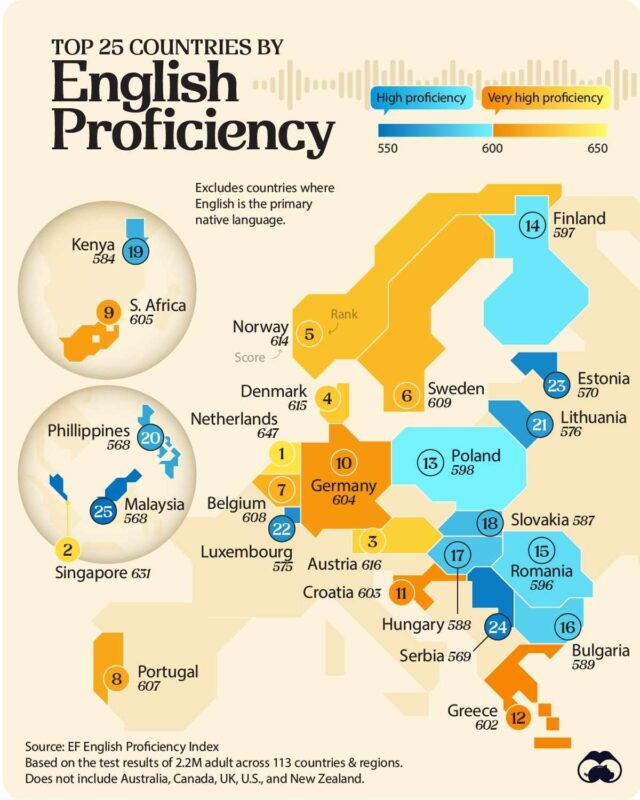
It is first in the EF English Proficiency Index 2025 with a score of 624, ahead of Croatia (617), Austria (616), Germany (615) and Norway (613).
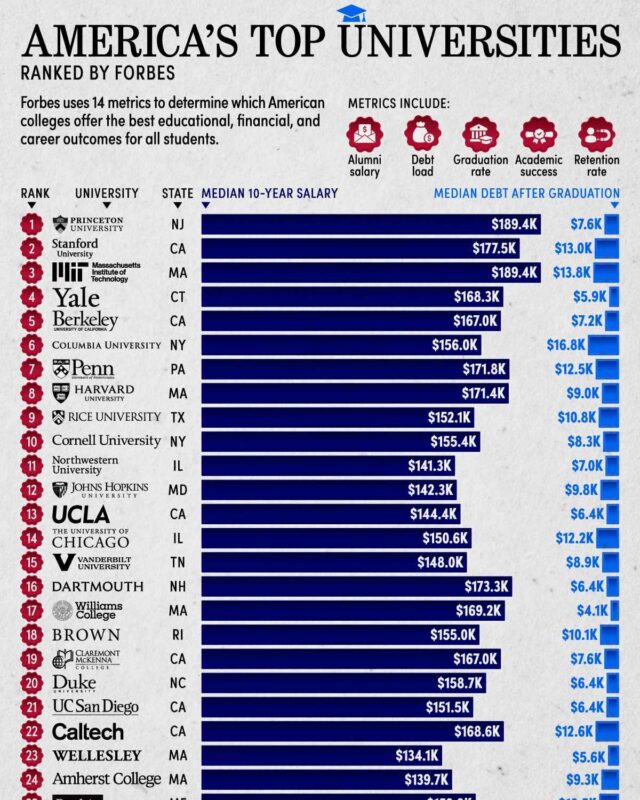
News' 2027 edition, both published in September 2026, with Princeton second.
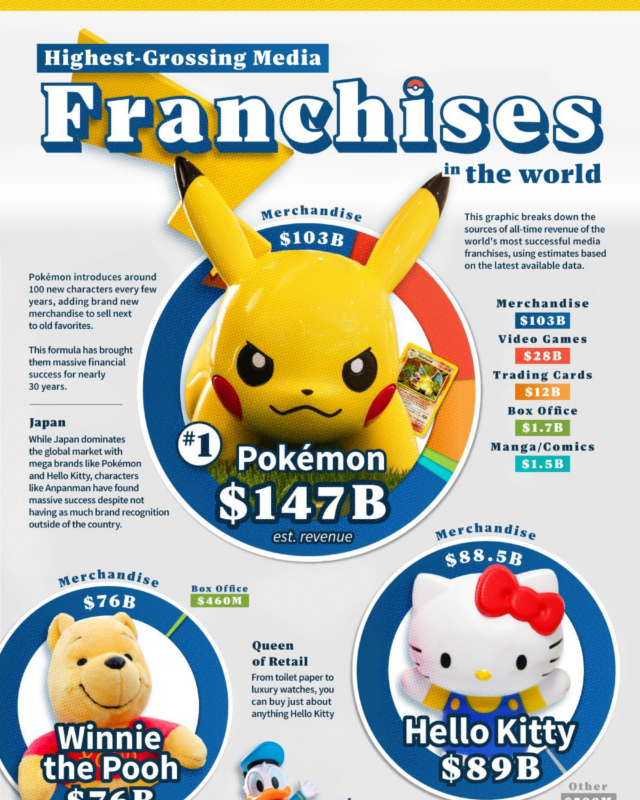
Hello Kitty, Winnie the Pooh, Mickey Mouse and Star Wars follow on Visual Capitalist's ranking, and every franchise in the top 10 is either Japanese or…

Massachusetts and Minnesota are close behind New Hampshire, Louisiana and Mississippi are near the bottom, and every state sits inside the average IQ range…
Is this your work? Tell us about a credit, a correction or a better description, and we will update this page.
Give it a permanent page where people looking for your subject find it, with your name and a link to your site. Content marketers, agencies, designers and researchers all list here.