
People and Society
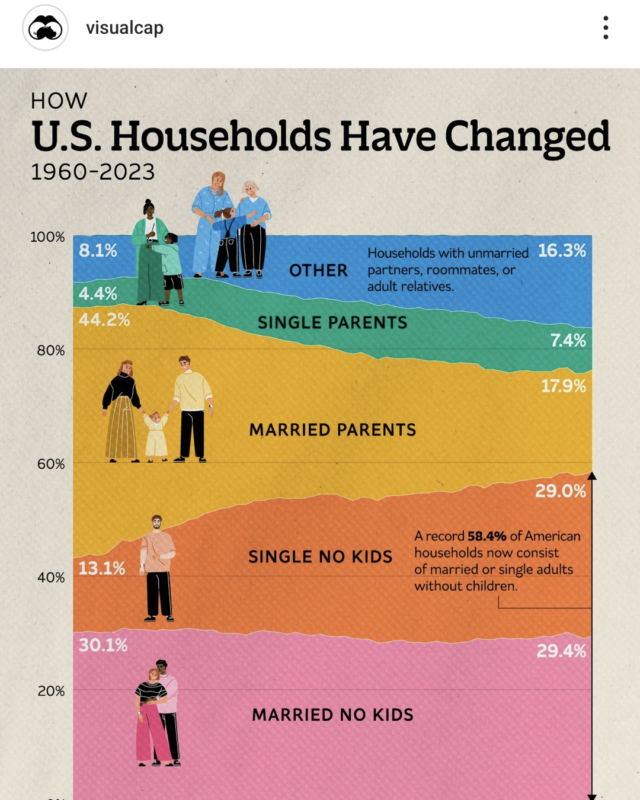
How US Households Have Changed, 1960 to 2023
Married couples with children fell from 44.2% of households to 17.9%, while single adults without children rose from 13.1% to 29.0%.

Infographic publisher
Visual Capitalist is an online publisher based in Vancouver, Canada, that has turned data into visual stories since 2011. You will find charts, maps and infographics on markets, technology, energy, demographics and the global economy. It has published more than 5,000 visuals, and also runs the Voronoi data app and the Elements site on natural resources.
Married couples with children fell from 44.2% of households to 17.9%, while single adults without children rose from 13.1% to 29.0%.

Digital entertainment apps such as Netflix and Disney+ took $8.2 billion, ahead of dating apps at $5.7 billion and short video apps at $4.3 billion.

The United States ($30.3 trillion) and China ($19.5 trillion) make up about 43% of the total, followed by Germany, Japan and India, while all of Africa…

It adds the top 10 historic events each generation named in a 2016 Pew Research Center survey.
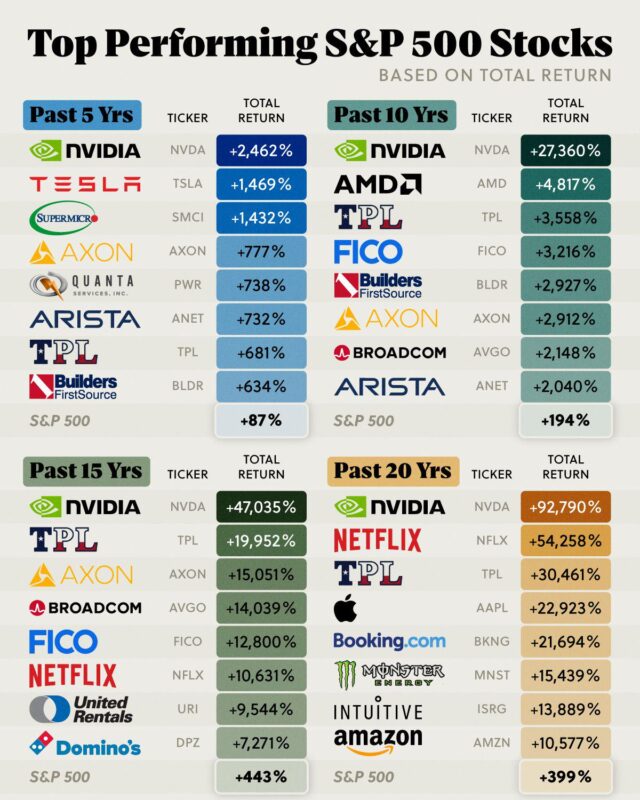
NVIDIA leads every period, up 92,790% over 20 years against 399% for the S&P 500.
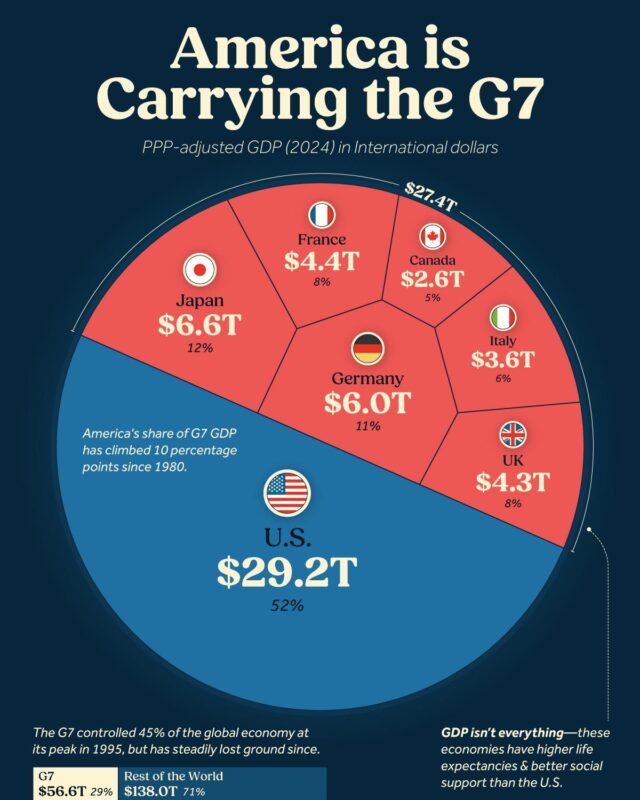
The United States accounts for $29.2 trillion, 52% of the group's $56.6 trillion, more than Japan, Germany, France, the UK, Italy and Canada combined.
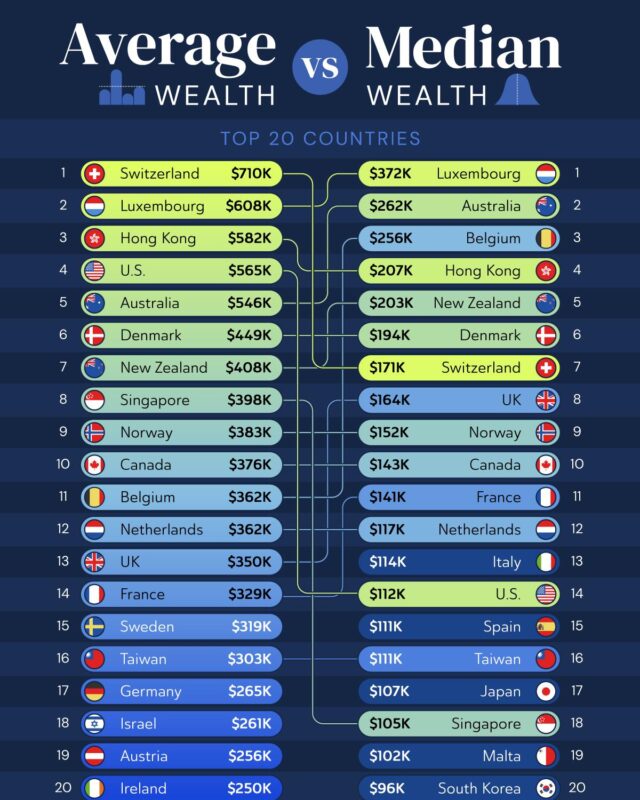
Luxembourg leads on median wealth at $372,000 per adult, while Switzerland leads on average wealth at $710,000.
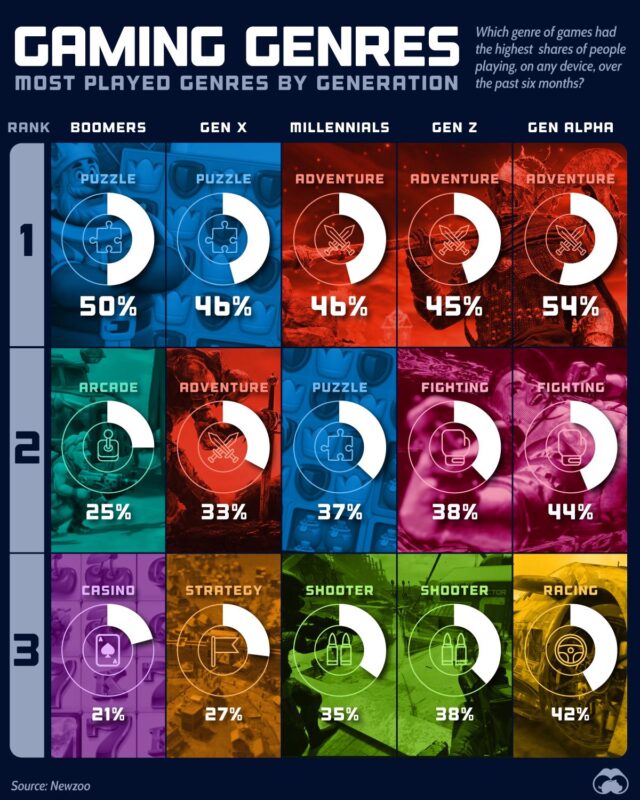
Puzzle games are the most played genre for Baby Boomers (50%) and Gen X (46%), while adventure games lead for Millennials, Gen Z and Gen Alpha, peaking at…

This Standard Model of particle physics poster from Visual Capitalist arranges the 17 fundamental particles on a radial chart: six quarks, six leptons and…

Hawaii is least affordable at 9.1, followed by California at 8.4, while West Virginia is lowest at 2.9.
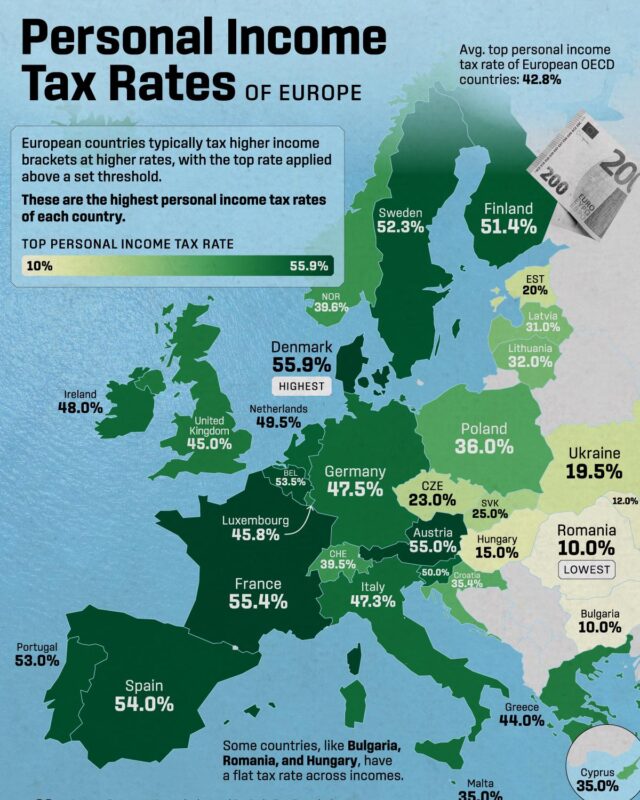
Denmark has the highest top rate of income tax at 60.5% in 2026, Belgium takes the most from an average worker's pay at 50.8%, and Hungary charges the…
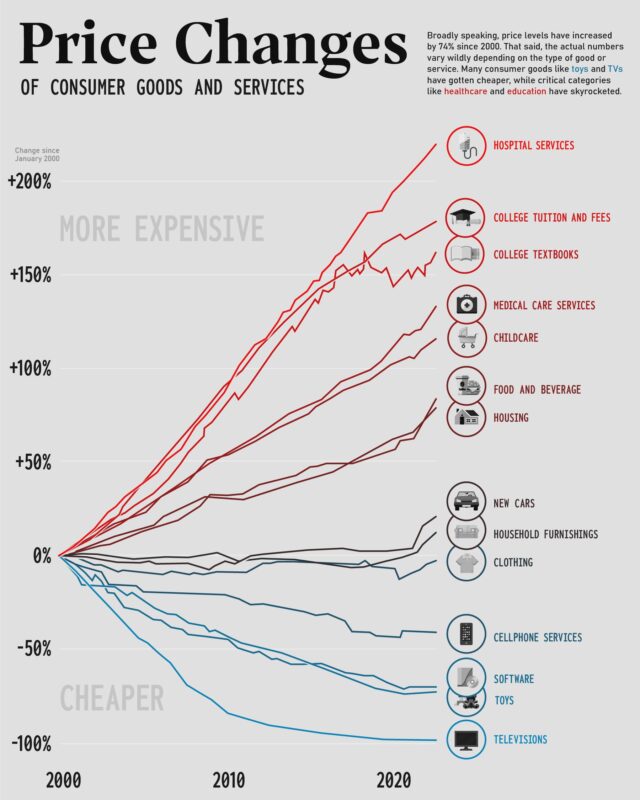
Services rose much faster: hospital services by 295%, college tuition by 208% and childcare by 166%.
Is this your work? Tell us about a credit, a correction or a better description, and we will update this page.
Give it a permanent page where people looking for your subject find it, with your name and a link to your site. Content marketers, agencies, designers and researchers all list here.