

Business
Largest Companies in the World by Revenue, Top 35
Walmart leads at $648 billion, followed by Amazon and China's State Grid.

Infographic publisher
Visual Capitalist is an online publisher based in Vancouver, Canada, that has turned data into visual stories since 2011. You will find charts, maps and infographics on markets, technology, energy, demographics and the global economy. It has published more than 5,000 visuals, and also runs the Voronoi data app and the Elements site on natural resources.
Walmart leads at $648 billion, followed by Amazon and China's State Grid.

The United States holds $11.8 trillion, close to half, followed by Japan with $2.1 trillion and Canada with $1.8 trillion.

Hawaii is highest at about $259,000, followed by Massachusetts and California, while West Virginia is lowest at about $82,000.

Oslo ranks first with 8.06 out of 10, Sofia and Athens follow, London is sixth, and Budapest is last on 3.13.

Washington, D.C. is longest at 5 hours 14 minutes and North Dakota shortest at 1 hour 50 minutes.
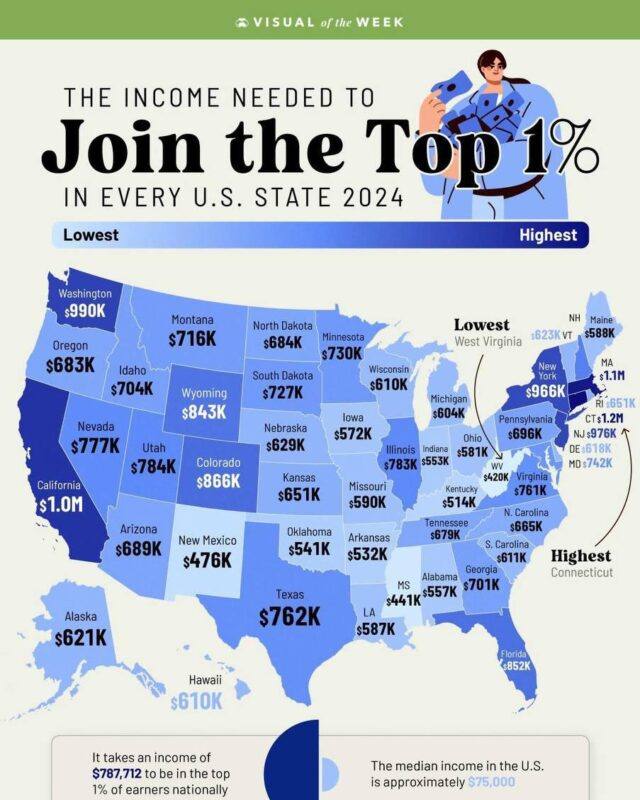
Nationally it takes $787,712 to join the top 1% of earners.

Exports to the top three alone supported more than 4 million US jobs.

NVIDIA led at $3.4 trillion, followed by Broadcom at $1.1 trillion and TSMC at $1.0 trillion, then ASML and Samsung.
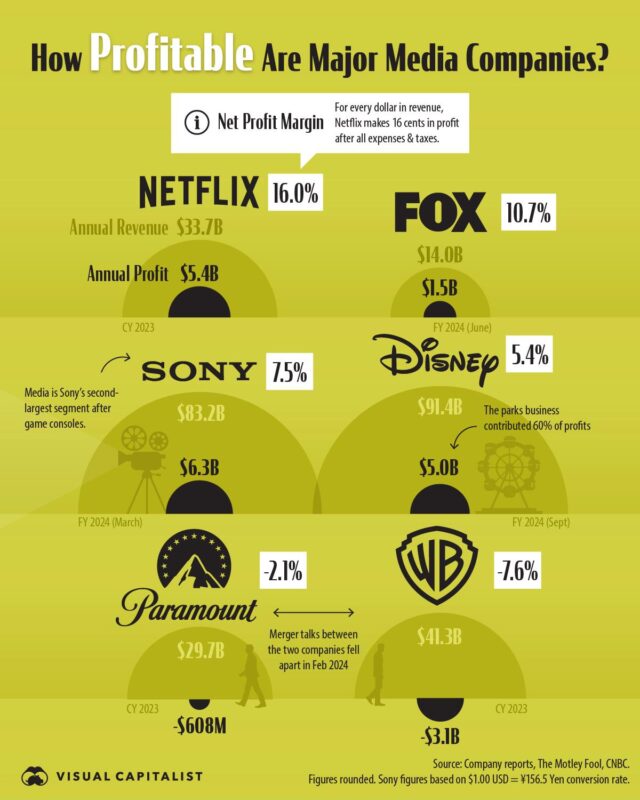
Netflix leads at 16.0%, making 16 cents of profit per dollar of revenue, ahead of Fox, Sony and Disney.
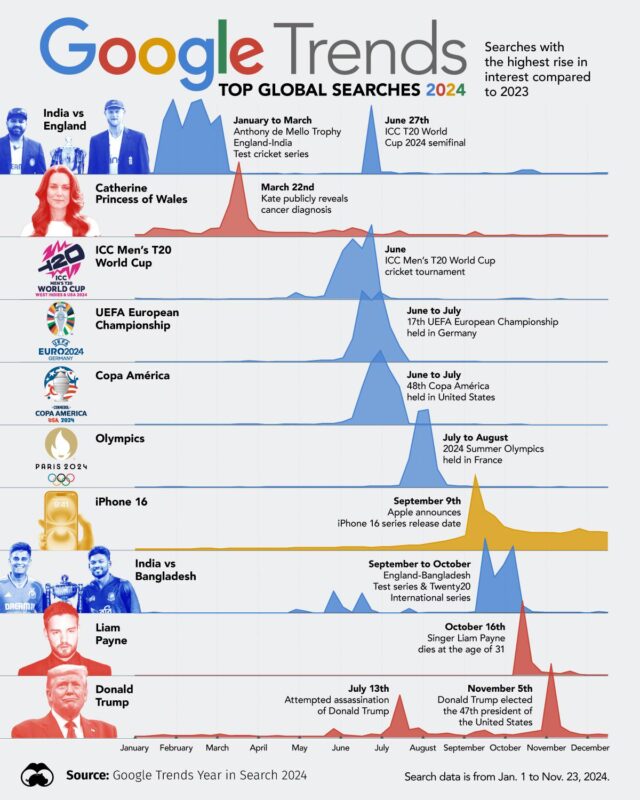
Six are sports events, led by Copa América, the UEFA European Championship and the ICC Men's T20 World Cup.
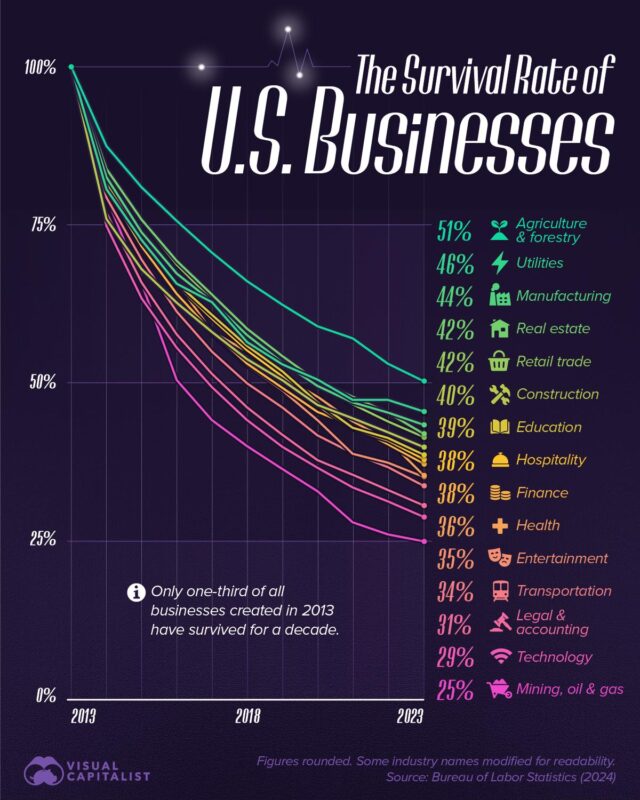
Agriculture and forestry held up best, with 51% surviving to 2023, while mining, oil and gas fared worst at 25%.
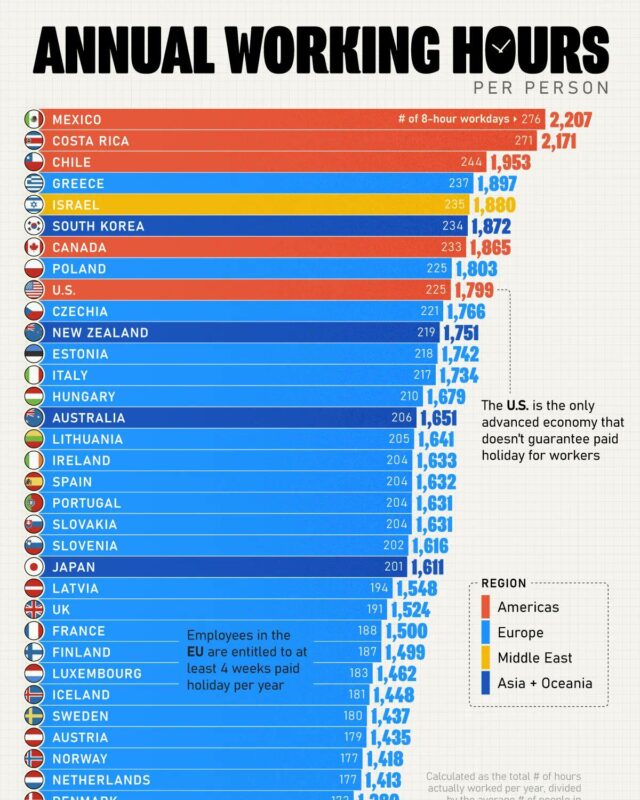
Mexico tops it at 2,207 hours per person in employment, about 276 eight-hour days, and Germany is lowest at 1,343.
Is this your work? Tell us about a credit, a correction or a better description, and we will update this page.
Give it a permanent page where people looking for your subject find it, with your name and a link to your site. Content marketers, agencies, designers and researchers all list here.