Eli Lilly’s income statement at a glance
Eli Lilly is now one of the most profitable drug makers in the world, and its income statement has changed fast. For the full year 2025, Lilly reported [3]:
| Full year | 2025 | 2024 | Change |
|---|---|---|---|
| Revenue | $65,179m | $45,043m | 45% |
| Cost of sales | $11,052m | $8,418m | 31% |
| Research and development | $13,337m | $10,991m | 21% |
| Marketing, selling and administrative | $11,094m | $8,594m | 29% |
| Acquired in-process R&D | $2,910m | $3,280m | -11% |
| Income before income taxes | $25,731m | $12,680m | 103% |
| Income tax expense | $5,091m | $2,090m | 144% |
| Net income | $20,640m | $10,590m | 95% |
That gives a gross margin of about 83% and a net margin of about 32% (our arithmetic) [3]. Net income almost doubled while revenue grew by under half, because most of the extra sales came from high-margin medicines while costs grew more slowly.
Where Lilly’s revenue comes from
Lilly’s growth rests on one molecule, tirzepatide, sold as Mounjaro for type 2 diabetes and as Zepbound for obesity in the US, Canada and Japan. In 2025 Mounjaro brought in $22,965 million and Zepbound $13,542 million, together $36.5 billion or 56% of the company’s revenue (our arithmetic) [3]. Zepbound had no sales at all in the second quarter of 2023 [2].
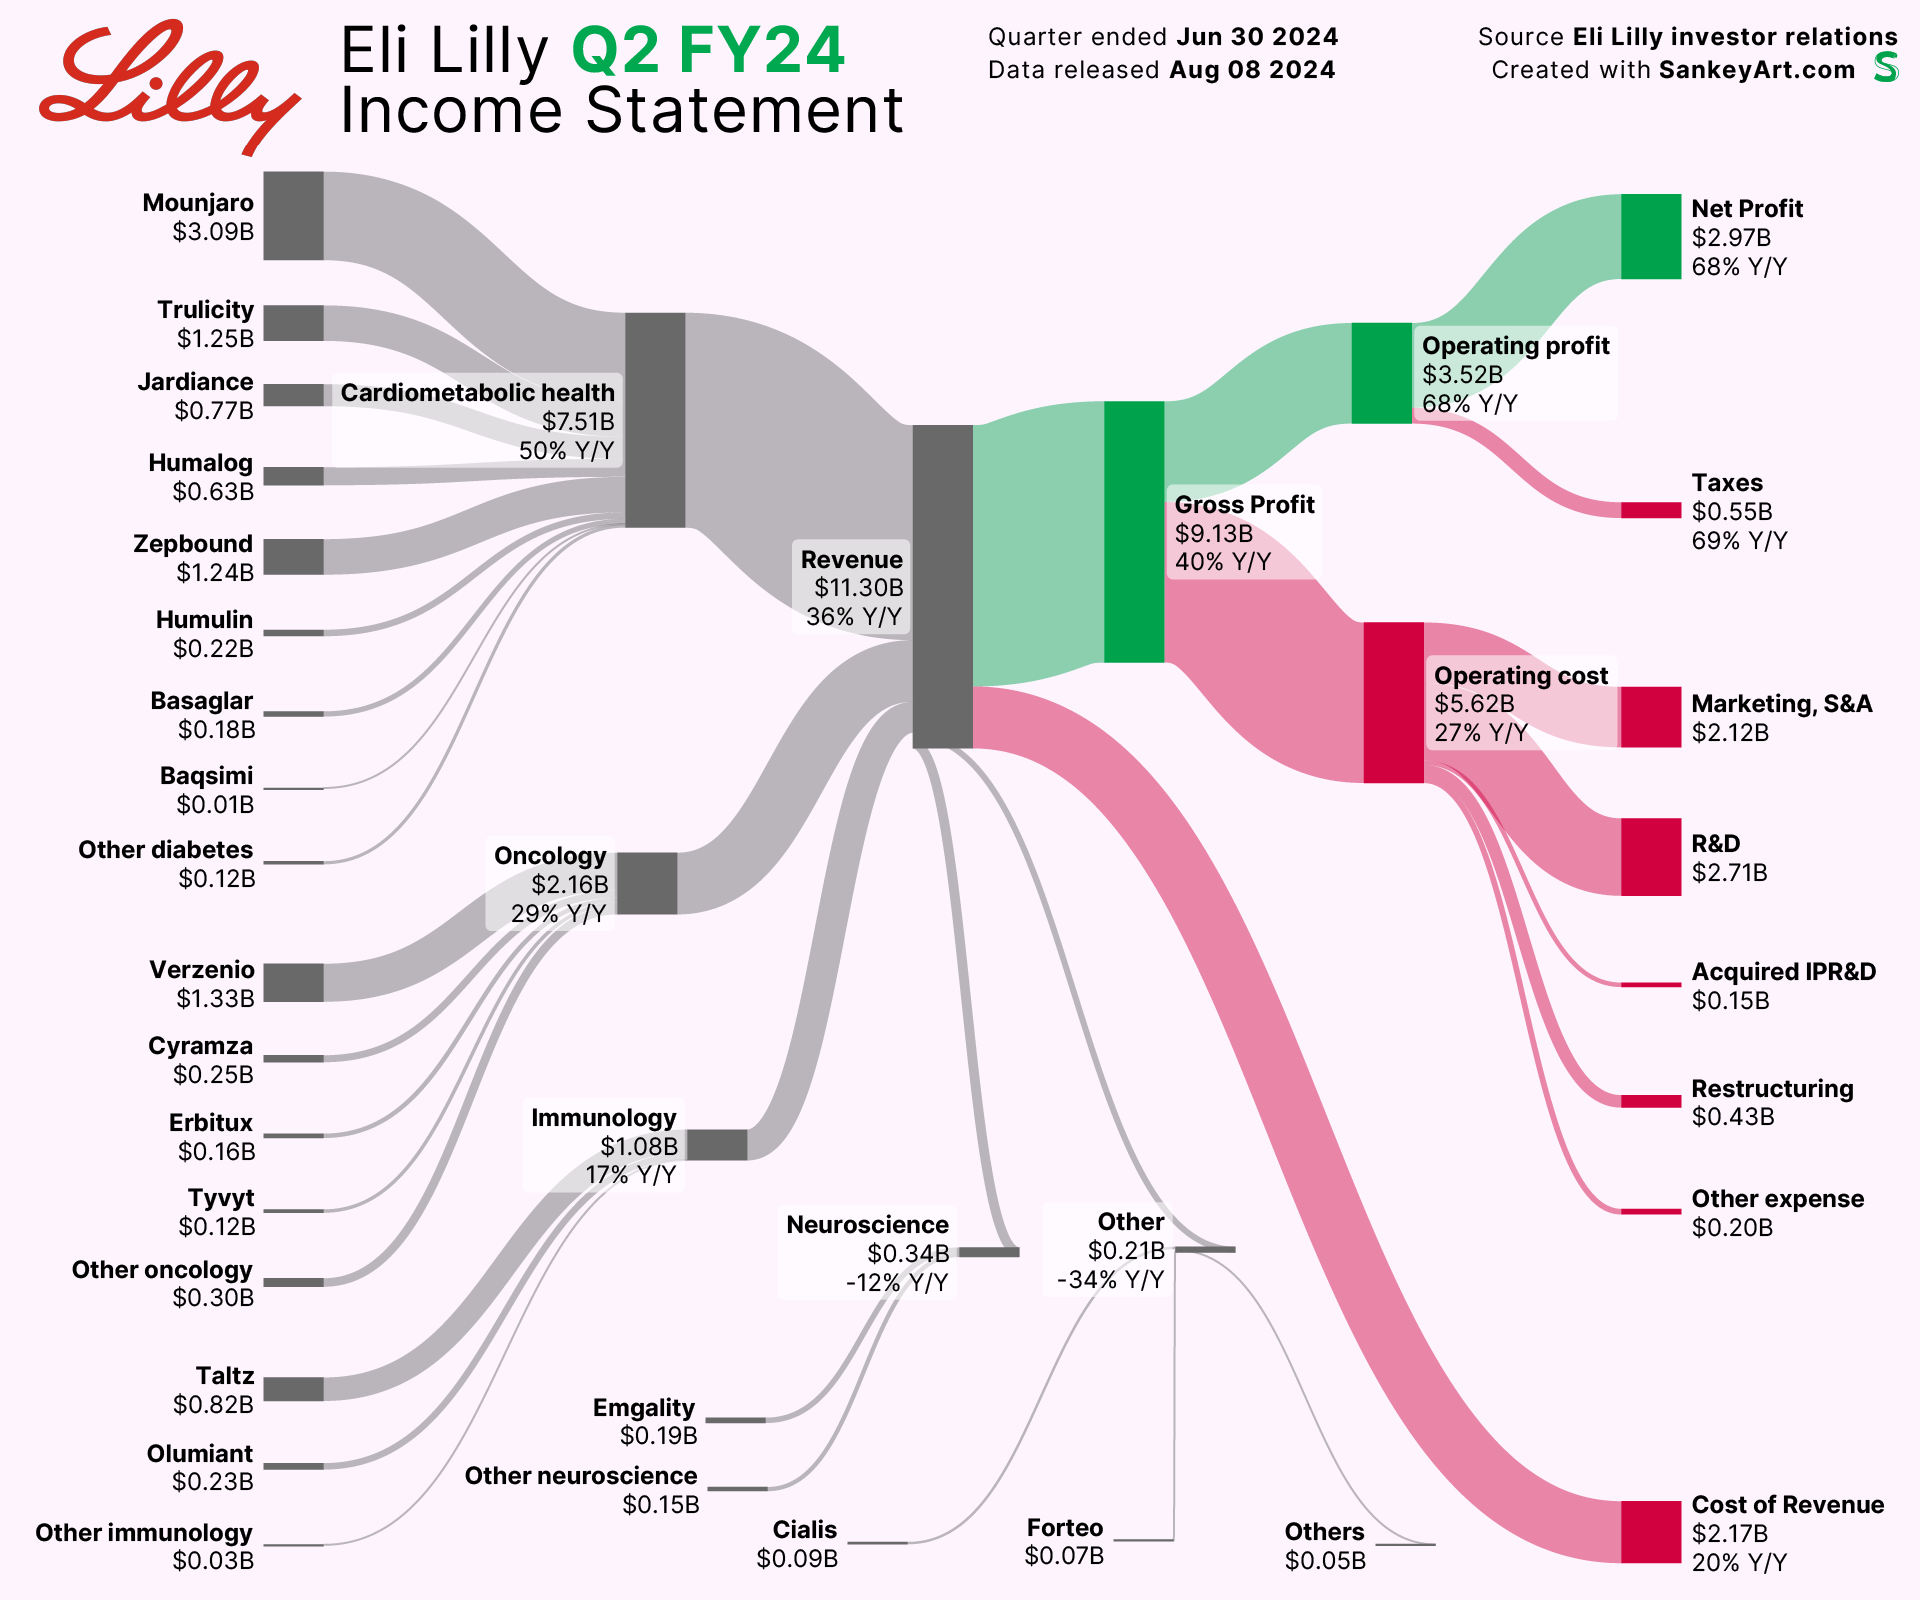
The SankeyArt diagram above shows how that shift began. In the second quarter of 2024, Lilly made $11.30 billion of revenue, up 36%, with cardiometabolic medicines providing $7.51 billion. Mounjaro made $3.09 billion and Zepbound $1.24 billion that quarter, about 38% of sales between them, while the older diabetes drug Trulicity still brought in $1.25 billion [1][2]. Oncology made $2.16 billion, led by the breast cancer drug Verzenio at $1.33 billion, and immunology $1.08 billion, led by Taltz [1][2].
By the third quarter of 2026, quarterly revenue had more than doubled to $24.4 billion, up 39% on a year earlier, with Mounjaro at $10.7 billion and Zepbound at $5.4 billion, about two-thirds of sales (our arithmetic) [4]. Lilly put the growth down to a 53% rise in volume, partly offset by a 15% fall in realised prices, driven mainly by Zepbound in the US and by Mounjaro’s inclusion on China’s national reimbursement drug list [4]. It raised its 2026 revenue guidance to between $91 billion and $92 billion [4].
Lilly’s costs: cost of sales, R&D and marketing
Drug makers have low production costs relative to price, so the big expenses sit below gross profit. In the Q2 2024 quarter shown in the diagram, revenue of $11.30 billion left $9.13 billion of gross profit after $2.17 billion cost of revenue; operating costs of $5.62 billion then included $2.71 billion of R&D and $2.12 billion of marketing, selling and administration [1][2]. The same pattern holds in 2025, with R&D the single biggest cost at $13.3 billion, about 20% of revenue [3].
Two lines can swing the result from one quarter to the next:
- Acquired in-process R&D is the cost of buying drug candidates from other companies. It is charged straight to the income statement. In Q3 2026 it came to $4.2 billion, mainly for the AtaiBeckley and Curevo acquisitions, which is why reported earnings per share rose only 16% while revenue rose 39% [4].
- Asset impairment, restructuring and other special charges covers one-off items. In Q2 2024 it was $435 million, related to anticipated litigation payments [2].
How to read a pharma income statement
A Sankey chart like the one above reads from left to right: product sales add up to revenue, then costs peel off until net profit is left. The same logic applies to Lilly’s published statement:
- Revenue: sales of medicines plus collaboration and milestone income, such as payments from Boehringer Ingelheim on Jardiance [4].
- Gross margin: revenue minus the cost of making the medicines. Lilly’s was 83.9% of revenue in Q3 2026 [4].
- Operating expenses: R&D, marketing and administration, acquired R&D and special charges.
- Other income or expense: mainly interest and investment gains or losses.
- Income tax, leaving net income.
Lilly also publishes non-GAAP figures that strip out items such as amortisation and special charges. They are useful for trends, but the GAAP figures above are what the income statement actually reports [3][4].
Questions about Eli Lilly’s income statement
What was Eli Lilly’s revenue in 2025?
$65.2 billion ($65,179 million), up 45% from $45.0 billion in 2024 [3].
What was Eli Lilly’s net income in 2025?
$20.6 billion ($20,640 million), up 95% on 2024, with diluted earnings per share of $22.95 [3].
How much of Lilly’s revenue comes from Mounjaro and Zepbound?
About 56% in 2025 ($36.5 billion of $65.2 billion), and about two-thirds in Q3 2026 (our arithmetic) [3][4].
How much does Eli Lilly spend on research and development?
$13.3 billion in 2025, about a fifth of revenue, plus $2.9 billion on acquired in-process R&D [3]. In Q3 2026 alone R&D was $4.2 billion [4].
What was Eli Lilly’s revenue in Q2 2024?
$11.30 billion, up 36%, with net income of $2.97 billion, up 68% [2].
Sources
- SankeyArt, Eli Lilly 2024 Q2 income statement, the original page for this diagram.
- Eli Lilly and Company, Form 10-Q for the quarter ended June 30, 2024, SEC EDGAR, filed 8 August 2024.
- Eli Lilly and Company, Lilly reports fourth-quarter 2025 financial results and provides 2026 guidance, 4 February 2026.
- Eli Lilly and Company, Lilly reports third-quarter 2026 financial results, raises full-year guidance, 29 October 2026.
Last reviewed 2 November 2026