US state governments collected $1.54 trillion in taxes in fiscal year 2025, up 4.3% on 2024, according to the U.S. Census Bureau. Sales and gross receipts taxes brought in 45.4% of it and individual income tax 33.7%. California collected the most, $275.0 billion, and Alaska the least, $1.7 billion.
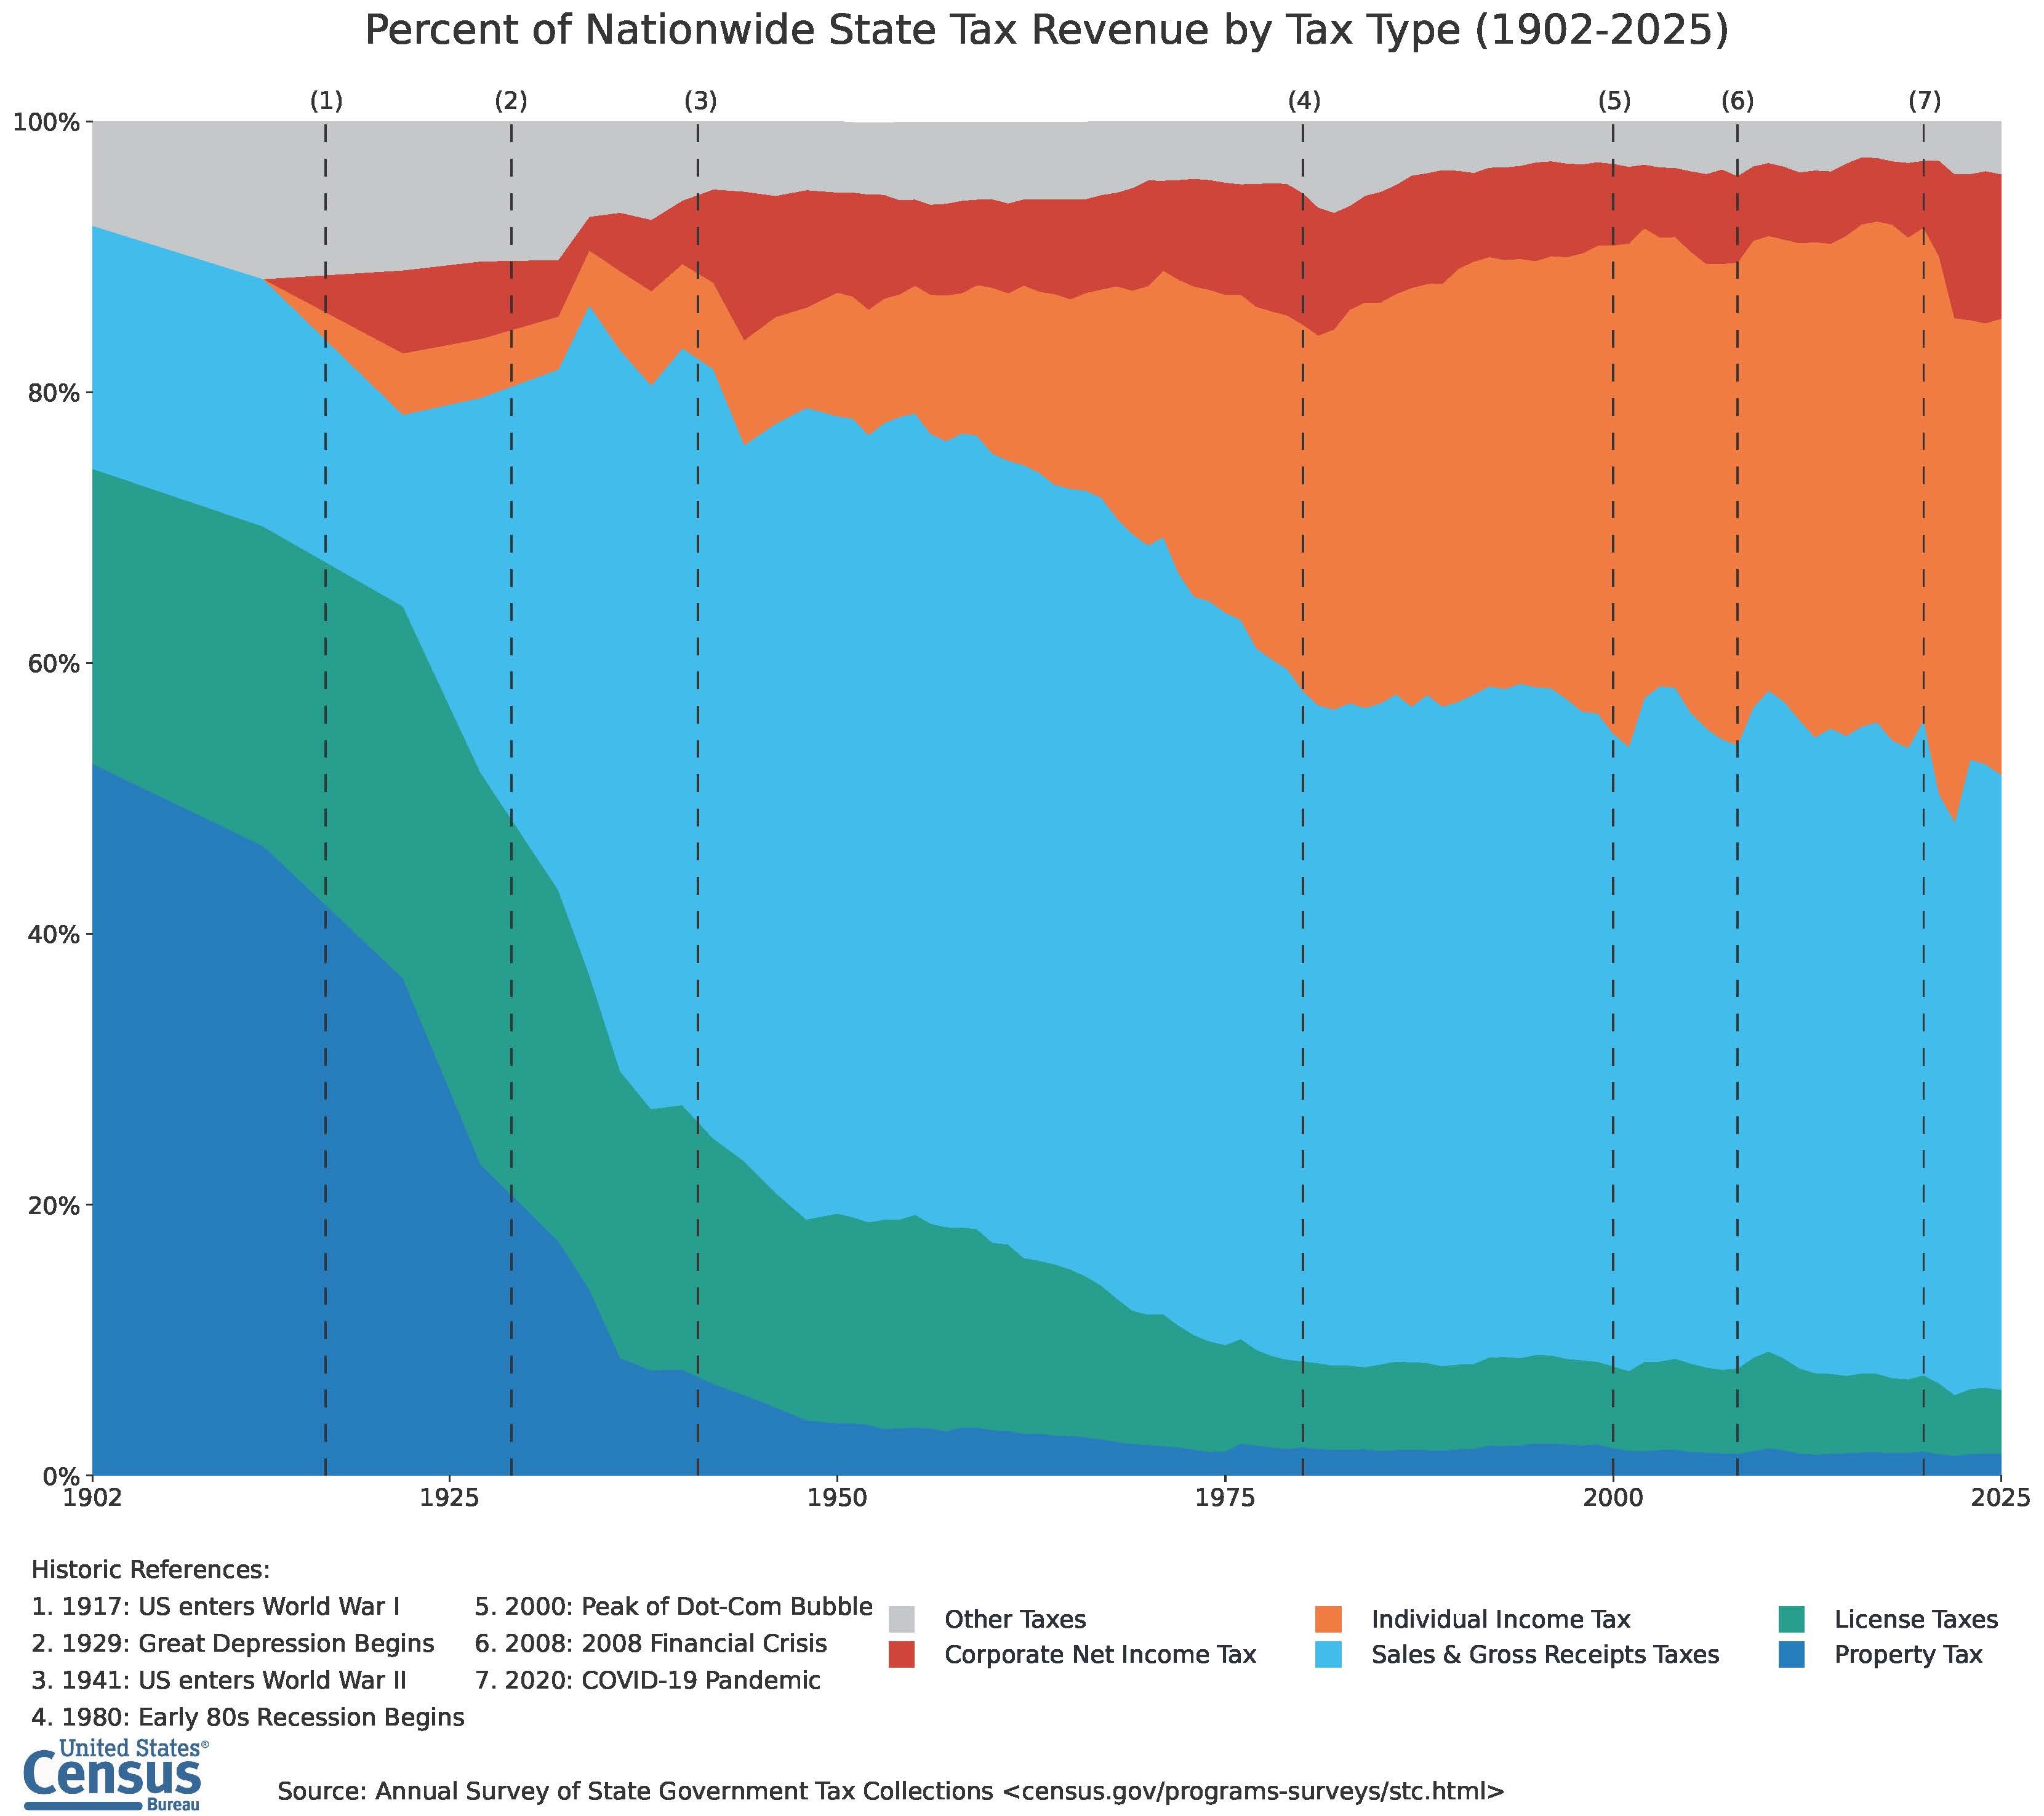
The figures come from the Census Bureau’s Annual Survey of State Government Tax Collections, which has tracked what each of the 50 state governments raises in tax every year since 1939. The infographic by the U.S. Census Bureau shown here draws on the same survey to show how the mix of state taxes has changed since 1902. Below you’ll find where state tax money comes from now, how that has shifted over 120 years, which states raise the most in total and per person, and what the money pays for.
How much tax do US states collect?
The 50 state governments collected $1,535.8 billion in tax revenue in fiscal year 2025, up from $1,472.0 billion in 2024, a rise of 4.3%. Those are the totals in the Census Bureau’s 2025 state tax data file, with dollar figures not adjusted for inflation.
Two things are worth knowing before you compare these numbers with others you might see. They count state governments only, so city, county and school district taxes (where most property tax goes) aren’t included. And they cover each state’s fiscal year, which, as the Census Bureau explains, ends on 30 June everywhere except Alabama and Michigan (30 September), New York (31 March) and Texas (31 August).
Where state tax revenue comes from
Sales taxes and income taxes pay for most of what states do. Together they made up almost 80% of state tax revenue in fiscal 2025.
| Type of tax | Revenue, FY2025 | Share of state tax revenue |
|---|---|---|
| Sales and gross receipts taxes | $697.4bn | 45.4% |
| Individual income tax | $517.4bn | 33.7% |
| Corporate net income tax | $163.7bn | 10.7% |
| Licence taxes | $72.2bn | 4.7% |
| Property tax | $25.5bn | 1.7% |
| Other taxes (severance, estate and gift, stock transfer and others) | $59.7bn | 3.9% |
Figures are our grouping of the Census Bureau’s 25 tax codes into the same six groups the infographic uses, and they match its 2025 shares.
Sales and gross receipts taxes split into two parts. General sales taxes, the percentage added at the till, raised $475.2 billion (30.9% of the total). Selective sales taxes on particular goods and services raised another $222.1 billion. The biggest of those were motor fuel taxes at $60.0 billion and taxes on insurance premiums at $37.7 billion, followed by tobacco ($14.8 billion), public utilities ($13.5 billion), amusements ($12.6 billion) and alcohol ($8.3 billion).
Individual income tax raised $517.4 billion, which makes it the largest single tax for states once general and selective sales taxes are counted separately. Corporate income tax raised $163.7 billion. About half of the $72.2 billion from licence taxes comes from motor vehicle licences ($36.5 billion), and the rest from business, hunting, fishing, driving and other licences.
How state taxes have changed since 1902
States have moved from taxing property to taxing spending and income. As the Census Bureau infographic shows, property tax made up just over half of state tax revenue in 1902 and only 1.7% in 2025.
Sales and gross receipts taxes overtook property tax in the 1920s and, through the Great Depression of the 1930s, became the largest group of state taxes, which they have been ever since. They peaked at more than half of all revenue in the middle of the century before settling at about 45%.
Income taxes came later. Individual and corporate income taxes appear on the chart by the early 1920s and stayed small until after the Second World War, then grew strongly from the 1960s. Individual income tax now brings in about a third of state tax revenue. Corporate income tax has stayed a much smaller share, and the chart shows it climbing after the COVID-19 pandemic to 10.7% in 2025.
Property tax didn’t disappear. It became a local tax, which is why it barely registers in state-only figures. The Census Bureau’s quarterly tax figures put state and local property tax at $833.3 billion across the four quarters of 2025 (before seasonal adjustment), against the $25.5 billion state governments collected in fiscal 2025. Nearly all of it goes to counties, cities, school districts and other local bodies.
What changed in 2025
Income tax drove most of the growth. Comparing the Census Bureau’s 2025 and 2024 data files, individual income tax rose 7.9% to $517.4 billion, while general sales tax grew 2.1% to $475.2 billion and corporate income tax fell 1.0% to $163.7 billion.
A few smaller taxes moved a lot. Sports betting and pari-mutuel taxes rose 28.6% to $3.3 billion. Severance taxes on oil, gas and minerals fell 9.9% to $19.8 billion, and tobacco taxes fell 5.3% to $14.8 billion.
Ten states collected less than the year before. Alaska fell the most (down 15.1%), as its severance taxes dropped from $1.04 billion to $0.74 billion, followed by Nebraska (down 10.2%) and North Dakota (down 5.7%). Oregon grew the most, up 21.0%, almost all of it from individual income tax, which rose from $9.5 billion to $13.1 billion. Oregon returns surplus revenue to taxpayers through its kicker credit, which can only be claimed on odd-year returns, so its income tax collections can swing from one year to the next.
Which states collect the most tax revenue?
California collects by far the most, $275.0 billion in fiscal 2025, which is 17.9% of all state tax revenue in the country. New York is second with $131.3 billion, then Texas ($89.9 billion), Illinois ($71.3 billion) and Florida ($63.6 billion). The ten biggest states by revenue collected 56.6% of the total between them.
Alaska collects the least, $1.7 billion, followed by Wyoming ($2.6 billion), South Dakota ($2.7 billion), New Hampshire ($3.4 billion) and Montana ($4.8 billion).
State tax revenue per person
Per person, Vermont’s state government collects the most, about $8,075 for every resident, and Alaska’s the least, about $2,288. Those are our calculations, dividing each state’s 2025 tax revenue from the Census Bureau by its Census population estimate for July 2025. Across all 50 states the average was about $4,503 per person.
After Vermont come Hawaii ($7,703), New Mexico ($7,028), California ($6,989) and North Dakota ($6,902). At the bottom, after Alaska, are New Hampshire ($2,383), Florida ($2,709), Texas ($2,836) and Missouri ($2,871).
A low state figure doesn’t always mean low taxes overall. States split public services with local government in different ways, so a state that leaves more to its cities and counties will show less here. Resource states such as North Dakota and New Mexico also collect large severance taxes on oil, gas and minerals, which push their per person figures up.
State tax revenue by state
This table lists every state’s tax revenue for fiscal year 2025 from the Census Bureau’s 2025 State Government Tax Tables, with per person figures calculated from Census population estimates and the change on fiscal 2024.
| State | State tax revenue, FY2025 | Per person | Change on FY2024 |
|---|---|---|---|
| California | $275.0bn | $6,989 | +3.6% |
| New York | $131.3bn | $6,563 | +9.5% |
| Texas | $89.9bn | $2,836 | +3.0% |
| Illinois | $71.3bn | $5,606 | +5.3% |
| Florida | $63.6bn | $2,709 | +0.7% |
| Pennsylvania | $56.5bn | $4,330 | +2.4% |
| New Jersey | $54.1bn | $5,662 | +6.8% |
| Massachusetts | $46.2bn | $6,454 | +7.2% |
| Michigan | $40.8bn | $4,029 | +5.7% |
| North Carolina | $40.6bn | $3,628 | +3.7% |
| Virginia | $40.3bn | $4,533 | +7.1% |
| Washington | $39.4bn | $4,920 | +5.4% |
| Ohio | $38.8bn | $3,264 | +3.7% |
| Minnesota | $36.9bn | $6,327 | +3.4% |
| Georgia | $34.4bn | $3,040 | +2.1% |
| Maryland | $32.9bn | $5,255 | +6.5% |
| Indiana | $27.4bn | $3,932 | +3.6% |
| Arizona | $26.6bn | $3,494 | +6.1% |
| Tennessee | $25.6bn | $3,496 | +5.9% |
| Wisconsin | $25.3bn | $4,236 | +4.7% |
| Connecticut | $24.8bn | $6,711 | +6.6% |
| Oregon | $20.5bn | $4,802 | +21.0% |
| Colorado | $20.3bn | $3,370 | +5.6% |
| South Carolina | $19.2bn | $3,455 | +6.8% |
| Missouri | $18.0bn | $2,871 | +1.2% |
| Alabama | $17.7bn | $3,403 | +4.8% |
| Kentucky | $17.3bn | $3,763 | +0.5% |
| Louisiana | $16.4bn | $3,547 | -0.4% |
| New Mexico | $14.9bn | $7,028 | +5.0% |
| Nevada | $14.5bn | $4,424 | -3.4% |
| Utah | $14.1bn | $3,994 | +5.2% |
| Kansas | $13.1bn | $4,406 | +0.4% |
| Oklahoma | $13.0bn | $3,164 | +0.1% |
| Arkansas | $12.6bn | $4,032 | -0.9% |
| Iowa | $12.1bn | $3,743 | -4.9% |
| Hawaii | $11.0bn | $7,703 | +4.4% |
| Mississippi | $11.0bn | $3,707 | +3.3% |
| Idaho | $8.9bn | $4,376 | +3.0% |
| Nebraska | $7.3bn | $3,614 | -10.2% |
| West Virginia | $7.0bn | $3,936 | -0.7% |
| Delaware | $6.9bn | $6,557 | +6.4% |
| Maine | $6.9bn | $4,889 | +6.3% |
| North Dakota | $5.5bn | $6,902 | -5.7% |
| Rhode Island | $5.5bn | $4,909 | +3.5% |
| Vermont | $5.2bn | $8,075 | +12.2% |
| Montana | $4.8bn | $4,225 | +2.5% |
| New Hampshire | $3.4bn | $2,383 | -3.6% |
| South Dakota | $2.7bn | $2,874 | +0.3% |
| Wyoming | $2.6bn | $4,363 | -2.7% |
| Alaska | $1.7bn | $2,288 | -15.1% |
How states differ in what they tax
States without an income tax tend to depend on sales tax, and the reverse. In the 2025 Census data, Florida took 62.9% of its tax revenue from general sales tax, Texas 62.8%, South Dakota 61.6%, Washington 59.4% and Tennessee 57.5%. At the other end, Oregon took 63.7% from individual income tax, Massachusetts 53.0%, Montana 47.7%, and Virginia and Georgia 47.3% each.
Census records no general sales tax revenue for Alaska, Delaware, Montana and New Hampshire. Delaware and Montana lean on income tax instead (39.6% and 47.7% of their tax revenue), while Alaska relies on severance taxes.
A few states lean on natural resources. Severance taxes made up 47.2% of North Dakota’s tax revenue ($2.6 billion), 43.9% of Alaska’s and 31.2% of New Mexico’s ($4.7 billion). Texas collected the most severance tax in dollars, $8.0 billion, but that was only 8.9% of its total.
What state tax revenue pays for
State budgets go mostly on health care and education. The National Association of State Budget Officers’ 2025 State Expenditure Report estimates total state spending at $3,212 billion in fiscal 2025, a figure that also includes money from the federal government, fees and borrowing. Medicaid made up 30.7% of it, K to 12 schools 18.2%, higher education 8.8%, transportation 7.8% and corrections 2.5%, with 31.9% on everything else.
Tax revenue mainly flows into states’ general funds, which paid for 37.9% of total state spending in 2025, according to the report summary. Federal funds paid for 33.5%. Within general fund spending, schools from kindergarten to 12th grade take the largest share.
Questions about state tax revenue
What state generates the most tax revenue?
California’s state government collects the most tax, $275.0 billion in fiscal year 2025, according to the Census Bureau. That is more than New York ($131.3 billion) and Texas ($89.9 billion) combined. Per person, Vermont collects the most, about $8,075 per resident.
What is the largest source of state tax revenue?
Sales and gross receipts taxes are the largest group, 45.4% of state tax revenue in 2025. Counted on its own, though, individual income tax ($517.4 billion) brings in more than general sales tax ($475.2 billion).
Which states have no income tax?
Alaska, Florida, Nevada, South Dakota, Tennessee, Texas and Wyoming collected no meaningful individual income tax in 2025, according to the Census data. Washington doesn’t tax wages but has a capital gains tax on individuals, and Census records $546 million of individual income tax there. New Hampshire’s tax on interest and dividends was repealed for tax periods beginning after 31 December 2024, and its collections halved to $91 million in fiscal 2025.
Which states have no sales tax?
Alaska, Delaware, Montana and New Hampshire collected no general sales tax at state level in 2025, according to the Census data. These are state taxes only, so they don’t include any sales taxes charged by local governments.
Why is property tax such a small part of state revenue?
Property tax is a local tax in the US. State governments collected just $25.5 billion of it in fiscal 2025, 1.7% of their tax revenue and down from just over half in 1902, while Census quarterly figures put state and local property tax together at $833.3 billion in 2025. Counties, cities and school districts collect nearly all of it.
Is state tax revenue going up?
Yes, overall. State tax revenue rose 4.3% in fiscal 2025 to $1.54 trillion, but 10 states collected less than in 2024, led by Alaska (down 15.1%) and Nebraska (down 10.2%). These figures aren’t adjusted for inflation.
The infographic shown here was created by the U.S. Census Bureau and, as a work of the US federal government, is in the public domain. Its use here does not imply endorsement by the Census Bureau, the U.S. Department of Commerce or the U.S. Government.
Sources
- U.S. Census Bureau, Percent of Nationwide State Tax Revenue by Tax Type (1902-2025) (20 May 2026)
- U.S. Census Bureau, 2025 State Government Tax Tables and FY2025 flat file, Annual Survey of State Government Tax Collections
- U.S. Census Bureau, FY2024 flat file, Annual Survey of State Government Tax Collections
- U.S. Census Bureau, About the Annual Survey of State Government Tax Collections
- U.S. Census Bureau, Quarterly Summary of State and Local Tax Revenue, Quarter Two 2026 (Table 1)
- U.S. Census Bureau, Annual estimates of the resident population for the United States and states, Vintage 2025
- National Association of State Budget Officers, 2025 State Expenditure Report and executive summary
- New Hampshire Department of Revenue Administration, Interest and Dividends Tax
- Washington State Department of Revenue, Capital gains tax
- Oregon Department of Revenue, Oregon surplus (kicker)