How high is the UK tax burden?
The UK tax burden is the total of all taxes as a share of the economy (GDP). On the OECD’s international measure it was 34.4% of GDP in 2024, almost exactly the OECD average of 34.1% [1]. The Office for Budget Responsibility (OBR), which uses a slightly different National Accounts measure, puts the UK’s tax take at 36.0% of GDP in 2025-26 [2].
So two things are true at once. By the UK’s own standards taxes are very high: the OBR expects the tax take to pass its previous historical high of 37.2% of GDP in 2027-28 and keep rising to 38.6% by 2031-32 [2]. By international standards the UK is in the middle of the table. As Dominic Brady’s infographic puts it, the UK’s record tax burden “is not that high” once you compare it with other rich countries.
UK tax burden over time
The UK has collected roughly 30% to 35% of GDP in tax for most of the last 60 years. On OECD figures, the ratio was 30.1% in 1965, peaked at 36.7% in 1982, fell to 29.1% in 1996 and then spent the 2000s and 2010s between about 31% and 33% [1].
The recent rise started after the pandemic. The OECD ratio went from 32.5% in 2019 to 34.2% in 2021 and 35.2% in 2022, then eased to 35.0% in 2023 and 34.4% in 2024 [1]. The OBR’s measure, which runs to the current year and beyond, shows the tax take rising from 32.9% of GDP before the pandemic in 2019-20 to 36.0% in 2025-26 [2].
The main reason is personal tax. The OBR says around two thirds of the increase in the tax take since 2019-20 comes from rising personal taxes, mainly frozen income tax thresholds and the increase in employer National Insurance contributions [3]. Frozen thresholds pull more people into tax, and into higher rate bands, as wages rise. Income tax and National Insurance thresholds are now frozen until April 2031 [2].
UK tax burden compared with other countries
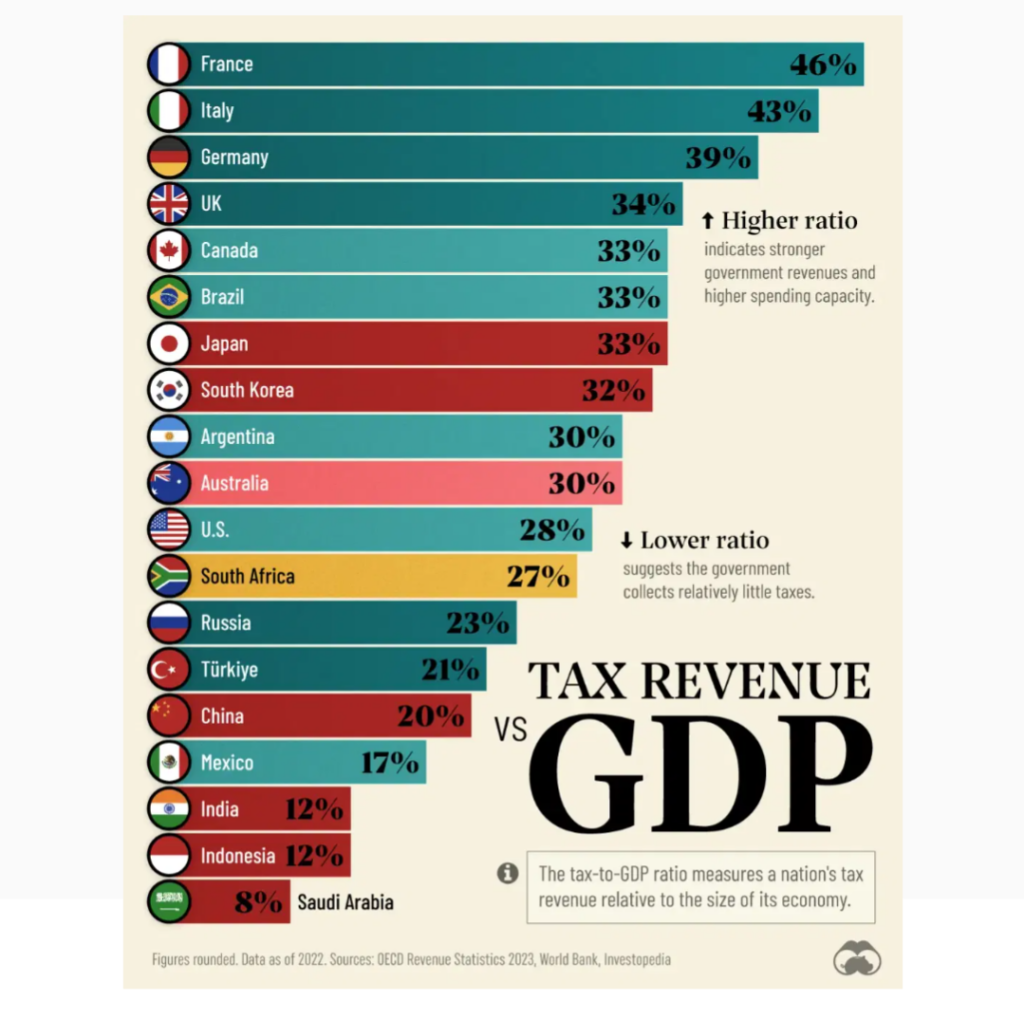
Among the 38 OECD members, the UK ranked 16th for its tax-to-GDP ratio in 2022 and 19th in 2023, when it was 35.0% against an OECD average of 33.7% [1]. In 2024 it was 22nd of the 36 countries that had reported figures [1]. The OECD average is a simple average of member countries, so it is pulled down by low tax countries such as Mexico, Chile and Ireland.
| Country | Tax revenue as % of GDP, 2024 |
|---|---|
| Denmark | 45.2 |
| France | 43.5 |
| Italy | 42.8 |
| Sweden | 41.4 |
| Norway | 40.2 |
| Netherlands | 38.5 |
| Germany | 38.0 |
| Spain | 36.7 |
| Canada | 34.9 |
| United Kingdom | 34.4 |
| OECD average | 34.1 |
| New Zealand | 32.9 |
| Switzerland | 27.2 |
| United States | 25.6 |
| Ireland | 21.7 |
| Mexico | 18.3 |
Source: OECD Revenue Statistics [1]. Japan and Australia had not reported 2024 figures.
The useful comparison is with the other big European economies. France (43.5%), Italy (42.8%), Germany (38.0%) and Spain (36.7%) all take a larger share of GDP in tax than the UK [1]. The UK takes much more than the US (25.6%) and Switzerland (27.2%) [1]. The OBR makes the same point: it said in March 2026 that the level of the UK tax take is not unusually high compared with other advanced economies [4].
How much tax does the average UK worker pay?
The tax wedge measures how much of the cost of employing someone goes in income tax and National Insurance, employee and employer. For a single person with no children on average earnings, the UK’s wedge was 32.4% of labour costs in 2025, against an OECD average of 35.1% [5]. That put the UK 26th of 38 countries [5].
The UK has been below the OECD average on this measure every year since 2000. Its wedge ranged between about 30% and 34% over that time and was 29.9% in 2024, before rising in 2025 [5]. In Belgium the same worker faces a wedge of 52.5% and in Germany 49.3% [5].
That fits with the infographic’s main argument. Over the last 20 years the UK’s overall tax burden has tracked the OECD average closely, while the tax on an average worker’s wages has stayed lower. More of the UK’s revenue comes from taxes on personal income and property than in the average OECD country, and less from social security contributions and corporation tax [6].
Who pays the most income tax in the UK?
Income tax in the UK is paid mostly by higher earners. HMRC’s latest figures for 2023-24 show the top 1% of income tax payers received 12.4% of all taxpayers’ income before tax and paid 27.2% of all income tax [7]. The top 10% received 34.0% of income and paid 59.1% of income tax. The bottom half of taxpayers received 24.9% of income and paid 9.9% of income tax [7].
The infographic, which cites the Institute for Fiscal Studies, gives the top 1% share as 13% of income and 28% of income tax. That matches HMRC’s figures for 2022-23 (12.9% and 28.5%) [7]. HMRC projects the top 1% share of income tax at 26.8% in 2025-26 [7].
Is there room to raise taxes?
Brady’s conclusion is that countries that spend more need to tax more, and that international comparisons show the UK has room to raise taxes if it wants better public services. That is his view rather than a settled fact, but the numbers behind it hold up: the UK’s tax burden is close to the OECD average and well below most large Western European countries [1].
The OBR adds a caution. It says a higher tax take increases the risk that the tax system holds back economic activity more than expected, and that the forecast rise relies heavily on income tax and National Insurance, which are sensitive to how fast wages grow [2]. It also forecasts government spending at 45.6% of GDP this year, well above the tax take, which is why the government still borrows [2].
Questions about the UK tax burden
What is the tax burden?
It is the total tax a government collects as a percentage of GDP. The OECD calls it the tax-to-GDP ratio. It includes income tax, National Insurance, VAT, corporation tax, council tax and every other tax [1].
Is the UK tax burden the highest it has ever been?
Not quite yet, on the OBR’s measure. The tax take was 36.0% of GDP in 2025-26, and the OBR forecasts it to pass the previous historical high of 37.2% in 2027-28 [2].
Why is the UK tax burden rising?
Mainly because of personal taxes. The OBR says frozen income tax and National Insurance thresholds and the employer National Insurance increase account for most of the rise since 2019-20 [3]. Capital taxes and corporation tax add to it in the forecast [2].
Is UK tax higher than the rest of Europe?
No, it is lower than most of western Europe. In 2024 the UK’s 34.4% of GDP compared with 43.5% in France, 42.8% in Italy, 38.0% in Germany and 36.7% in Spain [1].
How much income tax do the top 1% pay in the UK?
About 27% of all income tax in 2023-24, while receiving about 12% of all taxpayers’ income [7].
Sources
- OECD, Revenue Statistics, OECD countries: comparative tables, total tax revenue as % of GDP, 1965 to 2024 (read 3 November 2026).
- Office for Budget Responsibility, Economic and fiscal outlook, October 2026.
- Office for Budget Responsibility, Economic and fiscal outlook, November 2025.
- Office for Budget Responsibility, Economic and fiscal outlook, March 2026.
- OECD, Taxing Wages, comparative country indicators, average tax wedge for a single person at average earnings, 2000 to 2025 (read 3 November 2026).
- OECD, Revenue Statistics 2024, the United Kingdom (country note on tax structure).
- HMRC, Table 2.4, shares of total income and income tax for percentile groups, July 2026.
- Dominic Brady, The UK tax burden in its international context, r/dataisbeautiful (the original infographic, using OECD and IFS data).
Last reviewed 3 November 2026