US tax revenue in 2024 came to $4.92 trillion. That is what the federal government collected in fiscal year 2024 (October 2023 to September 2024), according to the Treasury’s Monthly Treasury Statement. It spent $6.75 trillion, so the deficit was $1.83 trillion. Individual income taxes brought in nearly half of all revenue and payroll taxes about a third.
The flow chart by USAFacts, shown here, traces the same Treasury figures from each tax to each area of spending [1]. This page covers fiscal year 2024 and how it compares with the years either side. For the year before, see our page on the federal budget for 2023.
How much tax revenue did the US collect in 2024?
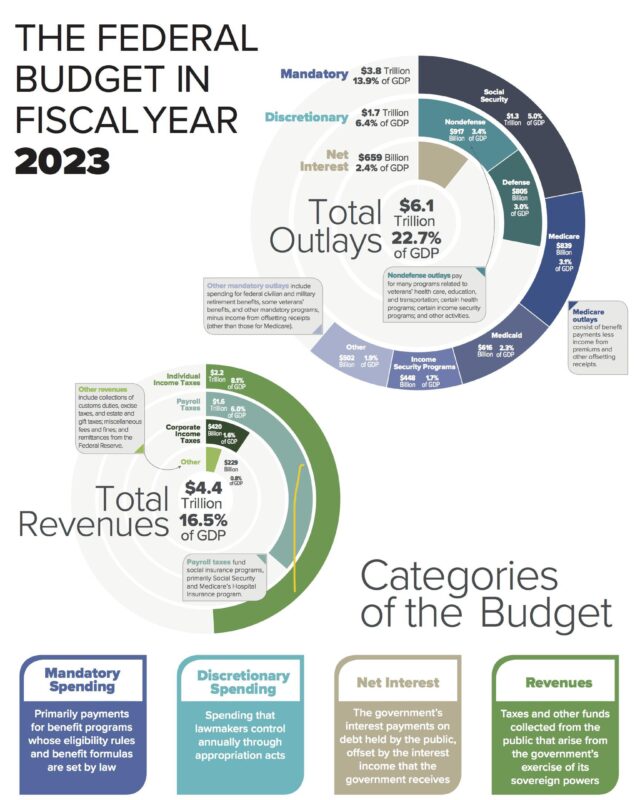
The federal government collected $4,919 billion in fiscal year 2024, up $479 billion (11%) on 2023, according to the Congressional Budget Office [2]. Revenue was 17.1% of GDP, up from 16.2% in 2023 and just under the 50 year average of 17.3% [2].
Part of the rise came from tax deadlines that had been pushed back from 2023 for people in federally declared disaster areas, so some 2023 tax was paid in fiscal year 2024 [2]. Collections rose in every major category, with individual income taxes up $250 billion [2].
Where federal revenue came from in 2024
Two taxes paid for most of the government. Individual income taxes and payroll taxes together brought in $4.14 trillion, 84% of all revenue, according to the Treasury’s Monthly Treasury Statement for September 2024 [3].
| Source | FY 2024 revenue | Share of total |
|---|---|---|
| Individual income taxes | $2,426 billion | 49.3% |
| Payroll (social insurance) taxes | $1,710 billion | 34.8% |
| Corporate income taxes | $530 billion | 10.8% |
| Excise taxes | $101 billion | 2.1% |
| Customs duties | $77 billion | 1.6% |
| Miscellaneous receipts | $43 billion | 0.9% |
| Estate and gift taxes | $32 billion | 0.6% |
| Total | $4,919 billion | 100% |
Source, Monthly Treasury Statement, September 2024, Table 4 [3]. Shares are our calculation from the Treasury figures.
Payroll taxes are different from income tax because they are tied to specific programmes. Of the $1.7 trillion, about $1.26 trillion went into the Social Security trust funds, and USAFacts puts Medicare taxes at $393 billion and unemployment taxes at $49 billion [1][3].
The smaller sources add up to less than 6% of the total. Excise taxes on motor fuel raised about $41 billion, tobacco taxes about $10 billion and alcohol taxes about $9 billion, and the 1% excise tax on companies buying back their own shares raised about $9 billion, as the USAFacts chart shows [1]. Customs duties on imports raised $77 billion, and estate and gift taxes $32 billion [3].
How much did the US government spend in 2024?
Federal outlays were $6,752 billion in fiscal year 2024, up $617 billion (10%) on 2023, according to the CBO [2]. That was 23.4% of GDP, against a 50 year average of 21.1% [2].
The biggest single increase was in education, up $309 billion [2]. That jump is an accounting effect rather than more money for schools. In 2023 the Supreme Court struck down the student loan cancellation plan, and reversing its cost made 2023 education spending unusually low, so 2024 looks high by comparison [2].
What the federal government spends money on
Social Security is the largest single programme, followed by health, interest on the debt, defence and Medicare, which were all close to $900 billion each. These are the Treasury’s budget function totals for fiscal year 2024 [3].
| Budget function | FY 2024 outlays | Share of total |
|---|---|---|
| Social Security | $1,461 billion | 21.6% |
| Health (mainly Medicaid) | $912 billion | 13.5% |
| Net interest | $882 billion | 13.1% |
| Medicare | $874 billion | 12.9% |
| National defence | $874 billion | 12.9% |
| Income security | $671 billion | 9.9% |
| Veterans benefits and services | $325 billion | 4.8% |
| Education, training, employment and social services | $305 billion | 4.5% |
| Transportation | $137 billion | 2.0% |
| All other functions, less offsetting receipts | $311 billion | 4.6% |
| Total | $6,752 billion | 100% |
Source, Monthly Treasury Statement, September 2024, Table 9 [3]. Income security covers programmes such as SNAP food aid, unemployment benefits, federal pensions and refundable tax credits.
USAFacts groups spending in its own way, which is why its chart shows a Defense total of $1.3 trillion. That group adds veterans’ support, foreign affairs and border security to the $877 billion it shows for national defence itself [1]. Keep that in mind if you compare the chart with the budget function figures above.
Most of this spending is mandatory, which means it is set by existing law (Social Security, Medicare, Medicaid and similar programmes) rather than voted on each year, and interest has to be paid whatever Congress decides.
Interest on the national debt overtook defence
In fiscal year 2024 the government spent more on net interest than on national defence for the first time. The Treasury’s figures put net interest at $882 billion and national defence at $874 billion [3]. The USAFacts chart shows the same order, with $878 billion of net interest against $877 billion for national defence [1].
The CBO uses a narrower measure, net interest on the public debt, and puts that at $949 billion for 2024, up $239 billion (34%) in a single year as higher interest rates fed through to the debt [2]. Debt held by the public reached 97.8% of GDP at the end of fiscal year 2024 [2].
The 2024 federal deficit
The deficit was $1,833 billion in fiscal year 2024, $138 billion more than in 2023 and equal to 6.4% of GDP, according to the CBO [2]. Since 1946 that share has been exceeded only in 2009 to 2012, 2020 and 2021 [2].
Timing shifts make the year look a little better than it was. Because 1 October fell on a weekend, $75 billion of payments due in fiscal year 2024 were made in September 2023. Without that and a similar shift a year earlier, the CBO says the 2024 deficit would have been 13% larger than in 2023 rather than 8% [2].
Tax revenue and spending since 2024
Revenue has kept rising, but spending has risen faster. The CBO’s summary for fiscal year 2026, published on 9 November 2026, gives these totals [4].
| Fiscal year | Revenue | Spending | Deficit | Deficit as % of GDP |
|---|---|---|---|---|
| 2023 | $4,441 billion | $6,128 billion | $1,687 billion | 6.2% |
| 2024 | $4,920 billion | $6,735 billion | $1,815 billion | 6.5% |
| 2025 | $5,235 billion | $7,010 billion | $1,775 billion | 5.9% |
| 2026 | $5,403 billion | $7,396 billion | $1,992 billion | 6.2% |
The CBO has since revised its 2024 figures slightly from those in its November 2024 report (now $6,735 billion of outlays and a $1,815 billion deficit), so both sets appear on this page [2][4].
The mix of revenue has also shifted. In fiscal year 2026 individual income taxes raised $2,846 billion (52.7% of the total), corporate income taxes fell to $381 billion and customs duties more than doubled from 2024 to $173 billion, according to the Treasury [3][4]. Net interest reached $1,052 billion in fiscal year 2026, more than national defence at $965 billion [3].
Questions about US tax revenue 2024
What is the annual federal tax revenue in the US?
Federal revenue was $4.92 trillion in fiscal year 2024, $5.23 trillion in fiscal year 2025 and $5.40 trillion in fiscal year 2026, according to the CBO and Treasury [2][4]. That is roughly 17% of GDP each year.
What is the biggest source of US government revenue?
Individual income tax. It raised $2.43 trillion in fiscal year 2024, 49% of all federal revenue, followed by payroll taxes at $1.71 trillion [3].
Who pays most of the federal income tax?
Higher earners pay most of it. The Tax Foundation’s analysis of IRS data shows the top 1% of taxpayers paid 40.4% of all federal income taxes in tax year 2022, up from 33.2% in 2001 [5]. Payroll taxes are spread more evenly because they apply from the first dollar of wages.
Who pays the 37% tax rate?
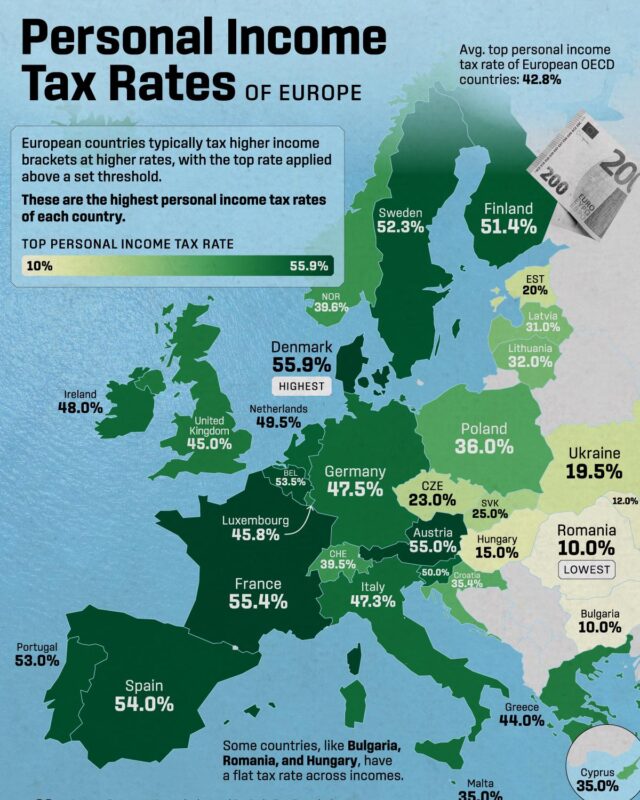
For the 2024 tax year the top 37% rate applied to taxable income above $609,350 for single filers and above $731,200 for married couples filing jointly [6]. It is a marginal rate, so it only applies to the part of income above those thresholds.
Did the US spend more than it collected in 2024?
Yes, by $1.83 trillion. For every dollar of spending in fiscal year 2024, about 73 cents came from revenue and the rest was borrowed (our calculation from the CBO totals) [2].
Sources
- USAFacts, US government spending, budget, and financing, 2024 government revenue and spending, using US Treasury data.
- Congressional Budget Office, Monthly Budget Review, Summary for Fiscal Year 2024, 8 November 2024.
- US Treasury, Bureau of the Fiscal Service, Monthly Treasury Statement, September 2024 and September 2026 (Tables 4 and 9).
- Congressional Budget Office, Monthly Budget Review, Summary for Fiscal Year 2026, 9 November 2026.
- Tax Foundation, Who Pays Federal Income Taxes? Latest Federal Income Tax Data.
- Tax Foundation, 2024 Tax Brackets.