

Finance and Economy
Gold to Oil Ratio History, Oil to Gold Price Index 1960 to 2024
The ratio peaked around 2008, hit its low in April 2020 with gold at $1683 an ounce and oil at $21 a barrel, and stood 30% below its 1960s level in 2024.
476 reviewed infographics. Search them, or narrow the list by topic and sort it the way you want.
The ratio peaked around 2008, hit its low in April 2020 with gold at $1683 an ounce and oil at $21 a barrel, and stood 30% below its 1960s level in 2024.

It shows that oceans hold 96.5% of Earth's water and only 2.5% is fresh, mostly frozen in ice caps or held as groundwater.
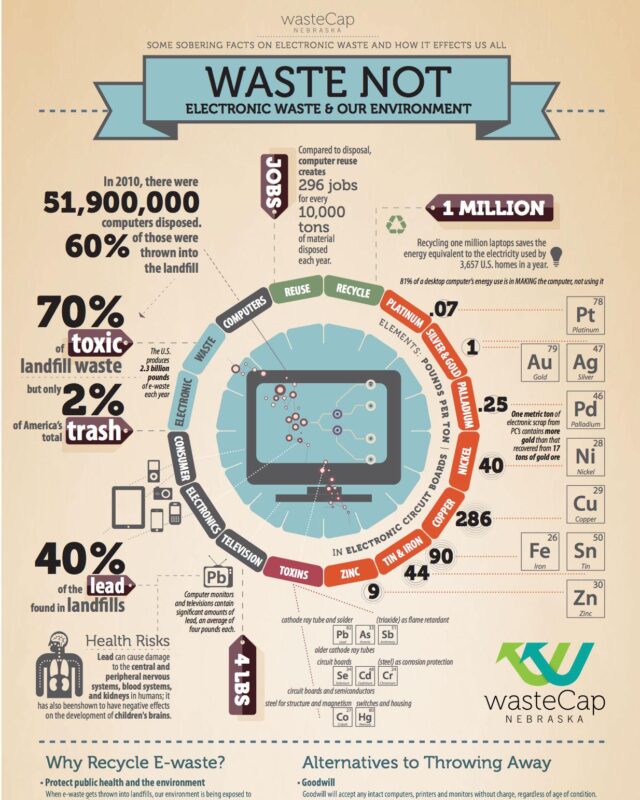
This electronic waste recycling infographic by WasteCap Nebraska sets out US e-waste facts from around 2010, the metals in circuit boards, the toxins in old…

If everyone lived like the average resident of the UAE, humanity would need 5.8 Earths a year; like Americans, 4.9; like the British or Chinese, 2.4; like…

India (35) and Russia (27) follow, then Japan, Saudi Arabia, Iran and South Korea.

Global natural gas production was about 392.7 billion cubic feet a day in 2023, roughly 4,060 billion cubic metres a year, and reached 4.34 trillion cubic…
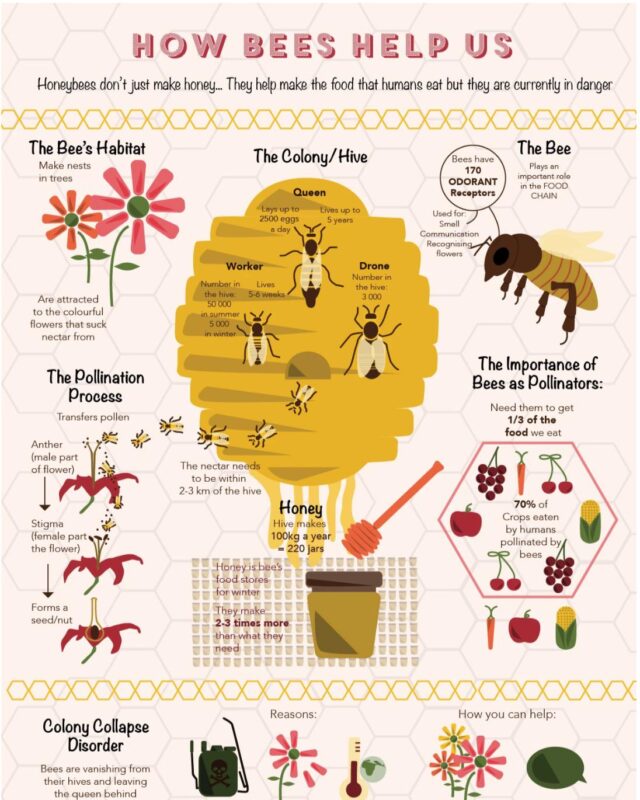
This bee infographic, titled How Bees Help Us, explains how a honeybee colony works and why people depend on bees.
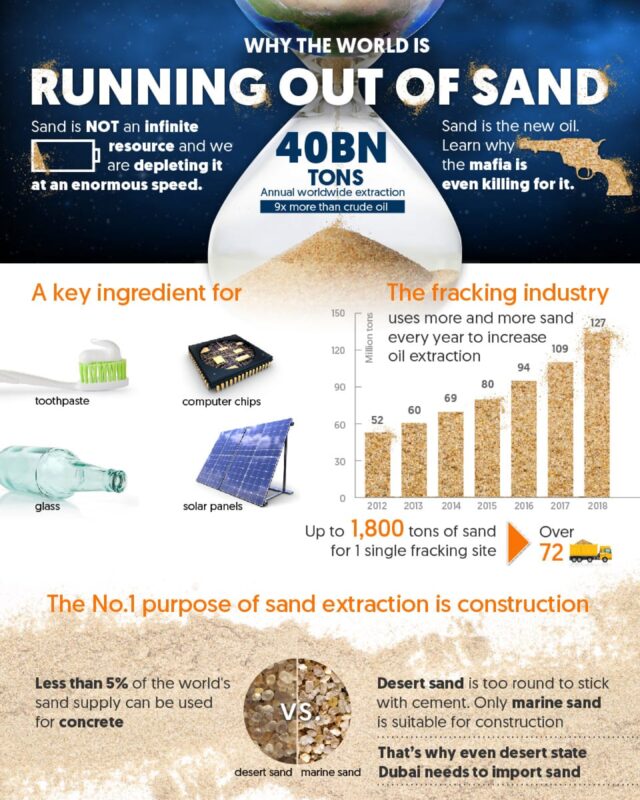
We use about 50 billion tonnes of sand and gravel a year, mostly for concrete, faster than rivers and coasts replace it.
Every topic page starts with a short guide to the subject.







Give it a permanent page where people looking for your subject find it, with your name and a link to your site. Content marketers, agencies, designers and researchers all list here.