
Technology
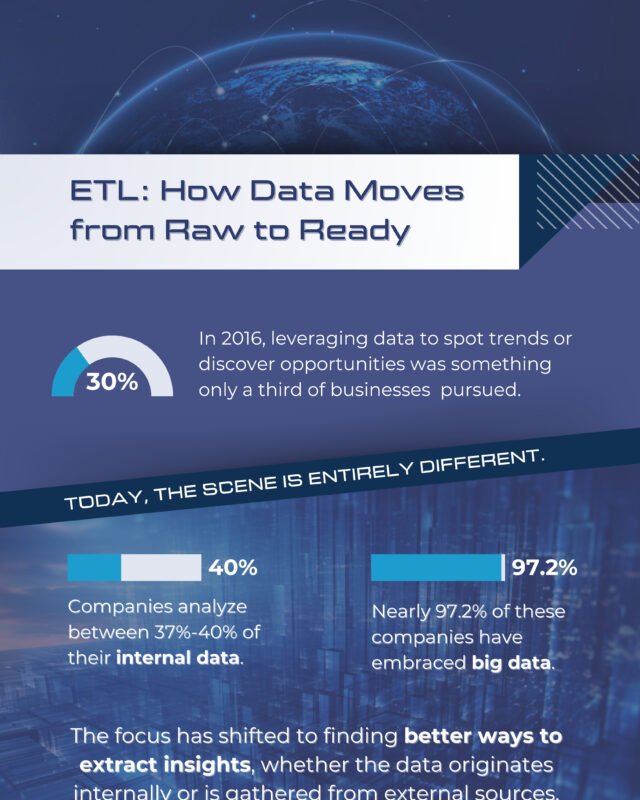
What Is ETL? Extract, Transform and Load Explained
The graphic also covers four types of ETL, claimed business results, 17 tools and five steps to implement it.
476 reviewed infographics. Search them, or narrow the list by topic and sort it the way you want.
The graphic also covers four types of ETL, claimed business results, 17 tools and five steps to implement it.

This hand drawn mind map sets out computer science basics in six branches: computers, problem solving, programming, data, communication and the bigger picture.

Training compute doubled about every 21 months until 2010 and about every 6 months since, rising from Theseus in 1950 to GPT-4 and Gemini 1.0 Ultra in 2023.

Their combined market value rose from $1.1 trillion in 2012 to $17.6 trillion at the end of 2024, a 26% annual rate.

Median total compensation ranges from $231k at entry level to $1.45M for a principal engineer at Facebook.
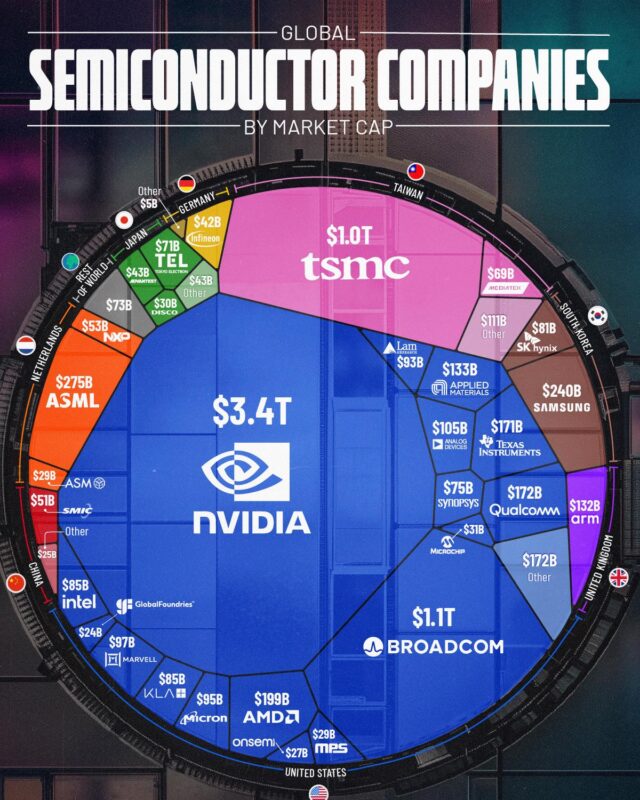
NVIDIA led at $3.4 trillion, followed by Broadcom at $1.1 trillion and TSMC at $1.0 trillion, then ASML and Samsung.

This Moore's law graph by Steve Jurvetson of Future Ventures, building on Ray Kurzweil's work, plots calculations per second per constant dollar from 1900…

Digital entertainment apps such as Netflix and Disney+ took $8.2 billion, ahead of dating apps at $5.7 billion and short video apps at $4.3 billion.
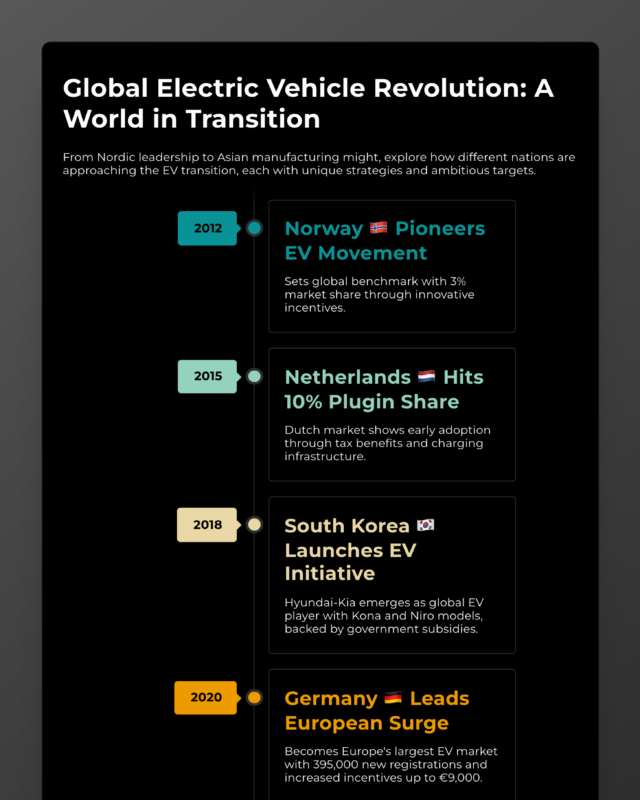
This StatPecker graphic is an electric vehicle history timeline for 2012 to 2023, with one milestone a year: Norway in 2012, the Netherlands in 2015, South…

Bitcoin accounted for $1,980 billion, about 54%, followed by other coins at $1,020 billion, Ethereum at $481 billion and stablecoins at $194 billion.

This cybersecurity threats infographic from CyberMaterial is a SOC guide to ten advanced attack techniques: DLL injection, heap spraying, privilege…

Software jobs grew from about 0.9 million to about 4.1 million, while hardware jobs fell from about 1.2 million to about 0.64 million and have been flat…
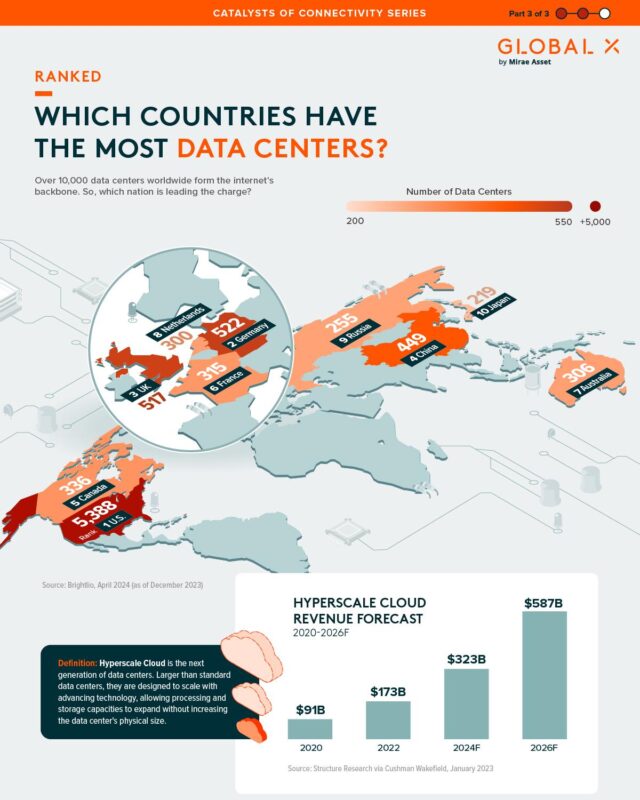
The United States leads with 5,388, more than the next nine countries combined, followed by Germany with 522, the UK with 517 and China with 449.

Alphabet leads with 222 deals worth $16.6 billion, ahead of Microsoft with 140 and Cisco with 134, while Salesforce spent the most at $61.5 billion.

The United States took 28% and Hong Kong 22.8%, together just over half.
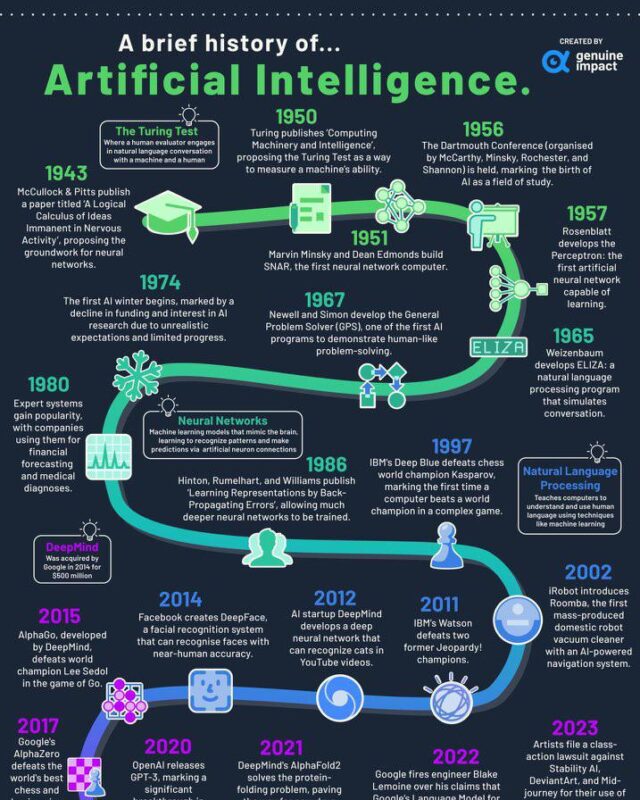
This history of artificial intelligence timeline by Genuine Impact runs from a 1943 paper on artificial neurons to a 2023 lawsuit over AI image generators,…

Of $69.7 billion in iPhone revenue, an estimated $42.2 billion went on cost of goods, led by the A17 Bionic chip at $9.5 billion.

NES games were the most expensive at $146 in today's money, and every console sits above the $70 price of a new game in 2024.
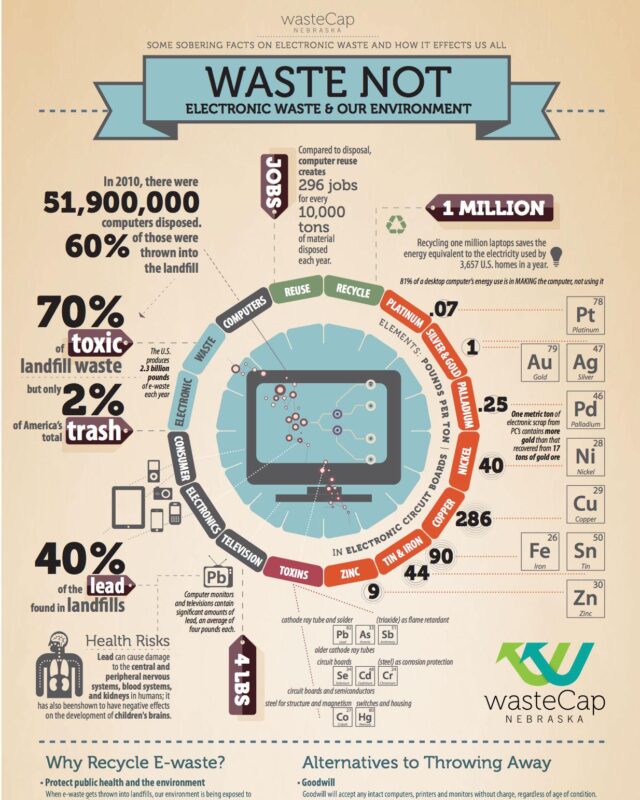
This electronic waste recycling infographic by WasteCap Nebraska sets out US e-waste facts from around 2010, the metals in circuit boards, the toxins in old…

The Neo Geo and 3DO are the most expensive, at about $1,500 or more in adjusted terms, while most consoles since 2000 sit between about $350 and $775.

MERPHI's poster of notable humanoid robots 2024 compares 12 machines against a 1.8 m human, from Boston Dynamics' electric Atlas and Tesla's Optimus Gen2 to…

China (78%), Saudi Arabia (76%) and India (71%) agree most, while France (31%), Canada (32%) and the Netherlands (33%) agree least.

It labels six life support components, from the emergency oxygen reserve to the primary oxygen tank, and says the suit weighed about 81 kilograms.

In 2021 the United States held 61% of chip design by value, Taiwan held 47% of fabrication against 27% for the US and 12% for China, and assembly, testing…
Every topic page starts with a short guide to the subject.






Give it a permanent page where people looking for your subject find it, with your name and a link to your site. Content marketers, agencies, designers and researchers all list here.