

Finance and Economy
Gold to Oil Ratio History, Oil to Gold Price Index 1960 to 2024
Since 1960 it has averaged about 21 barrels, ranging from under 7 in June 2008 to about 80 in April 2020.

Infographic publisher
Econovis is an economic research and data visualisation studio that turns macroeconomic, financial and business data into clear charts. Its blog covers the global money supply, world and US trade, energy and oil, markets and the US economy, and it also produces research, social media content and company reports for businesses, analysts and journalists. Here you will find its charts on trade, energy and money supply.
Since 1960 it has averaged about 21 barrels, ranging from under 7 in June 2008 to about 80 in April 2020.

This world trade infographic by Econovis shows how much each country relies on services: Luxembourg (90%), Malta (88%) and the Bahamas (86%) most, big goods…
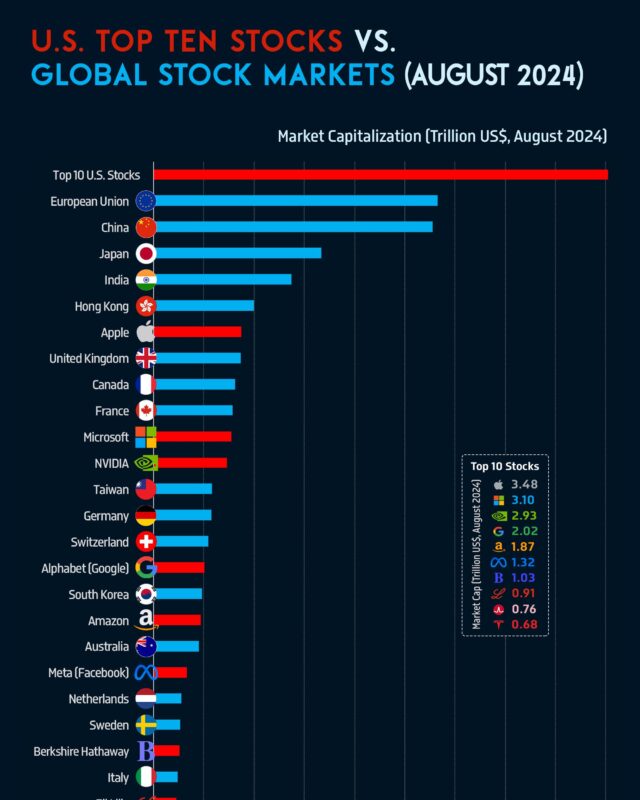
In August 2024 the ten largest US stocks were worth $18.1 trillion together, more than the whole stock market of the European Union or China.

That is just under half (about 47%) of all homes, down from 78% in 1950.

On Realtor.com's September 2026 figures the US median listing price was $419,250, with Hawaii, California and Massachusetts the most expensive states and…

Global natural gas production was about 392.7 billion cubic feet a day in 2023, roughly 4,060 billion cubic metres a year, and reached 4.34 trillion cubic…

Germany, Japan, South Korea, Vietnam, Taiwan, India and Ireland complete the top ten, and the 27 EU countries together supplied more than any single country.

Goods alone ran a deficit of about $1.2 trillion.
Is this your work? Tell us about a credit, a correction or a better description, and we will update this page.
Give it a permanent page where people looking for your subject find it, with your name and a link to your site. Content marketers, agencies, designers and researchers all list here.