

Finance and Economy
What Does the US Import From Canada, 1990 to 2024
In the 12 months to September 2024, mineral fuels led at $133.7 billion, ahead of other manufactured goods and machinery and transport equipment at about…

Infographic publisher
Econovis is an economic research and data visualisation studio that turns macroeconomic, financial and business data into clear charts. Its blog covers the global money supply, world and US trade, energy and oil, markets and the US economy, and it also produces research, social media content and company reports for businesses, analysts and journalists. Here you will find its charts on trade, energy and money supply.
In the 12 months to September 2024, mineral fuels led at $133.7 billion, ahead of other manufactured goods and machinery and transport equipment at about…
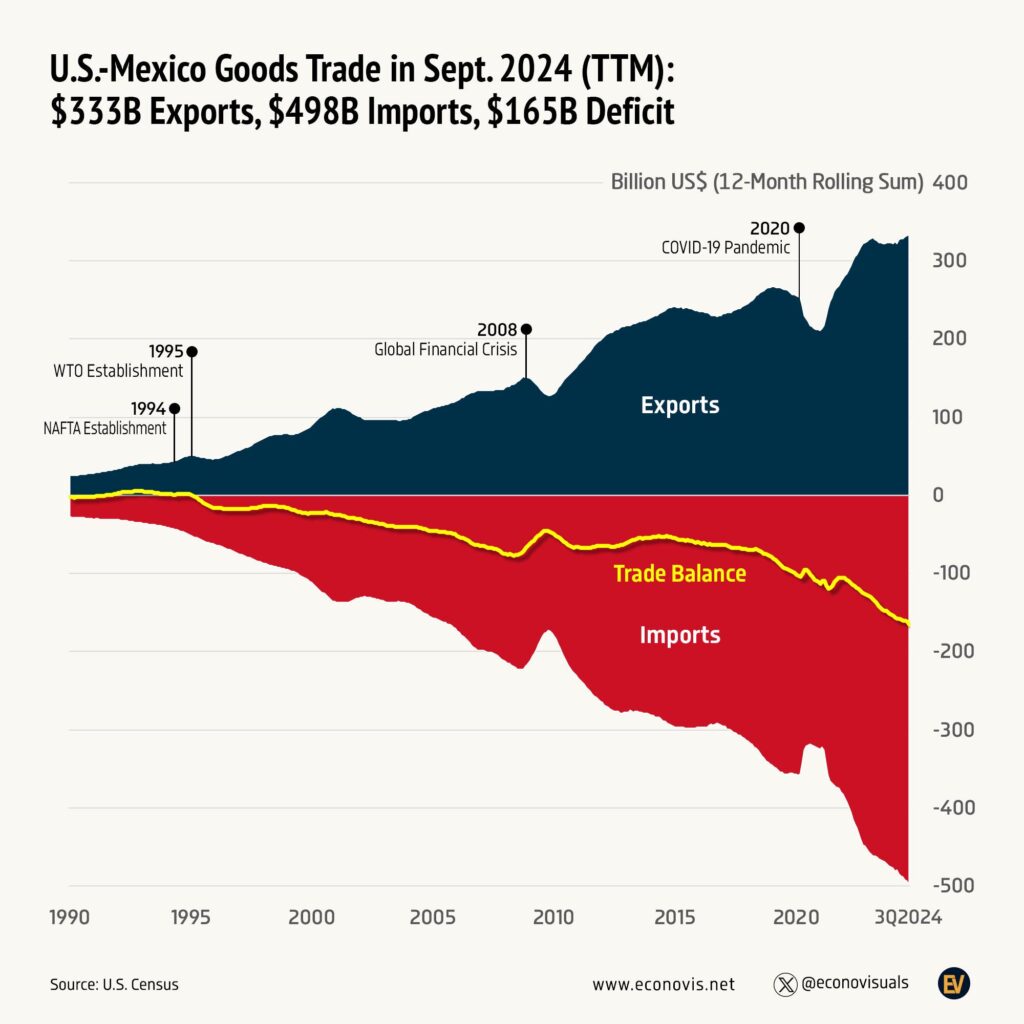
In the 12 months to September 2024, the US exported US$333 billion of goods to Mexico and imported US$498 billion, a US$165 billion deficit.

World pharmaceutical exports passed $900 billion that year.
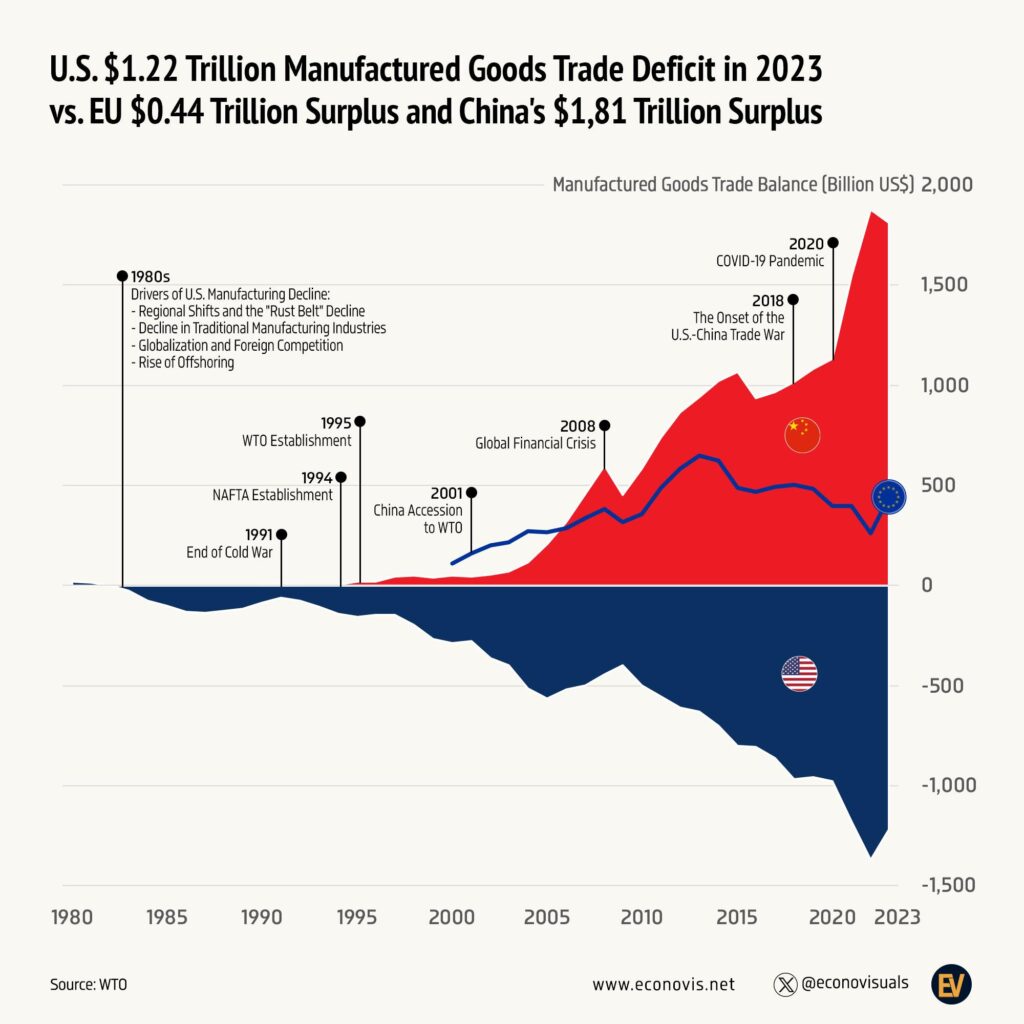
This Econovis chart sets the US manufactured goods trade deficit of $1.22 trillion in 2023 against China's $1.81 trillion surplus and the EU's $0.44…

Sales boomed to a peak of 74,300 in 2022, then fell back to about 23,800.
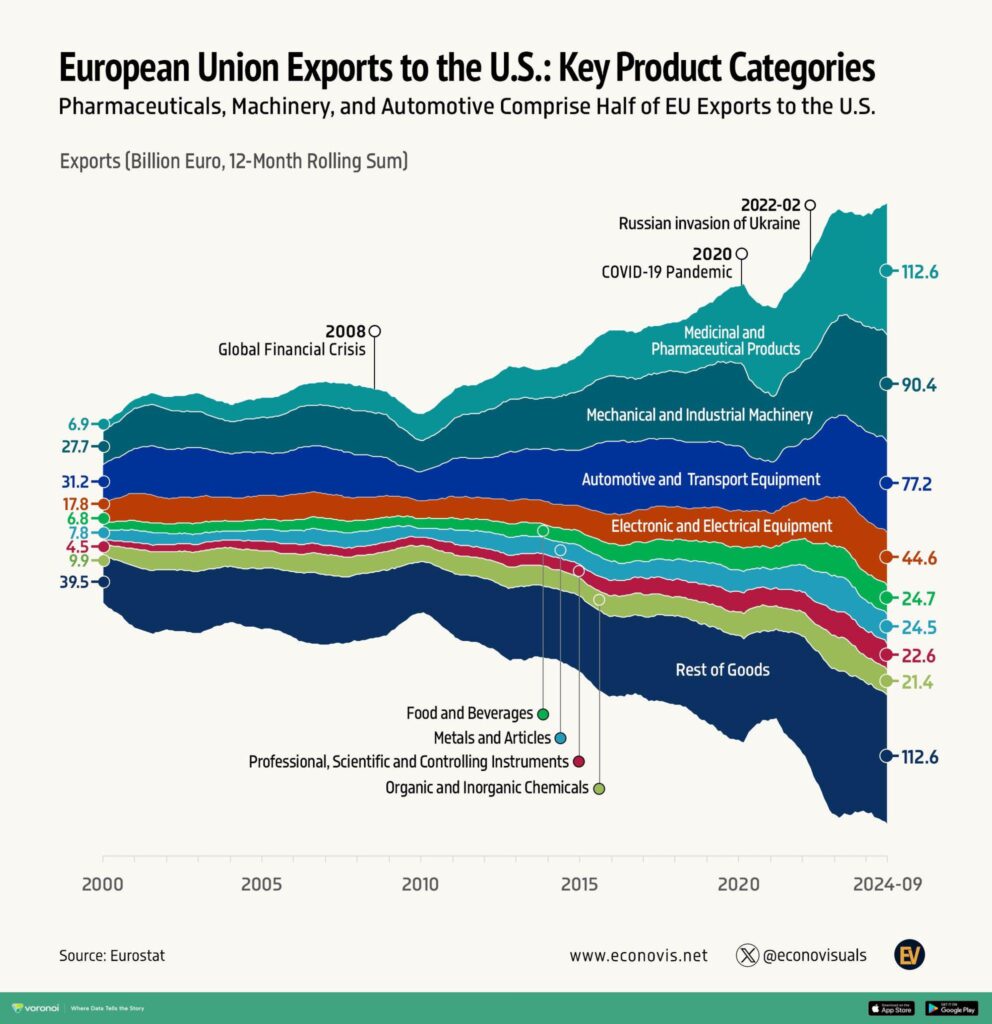
Pharmaceuticals grew from €6.9 billion to €112.6 billion and, with machinery (€90.4 billion) and vehicles (€77.2 billion), now make up about half of EU…

Bitcoin accounted for $1,980 billion, about 54%, followed by other coins at $1,020 billion, Ethereum at $481 billion and stablecoins at $194 billion.
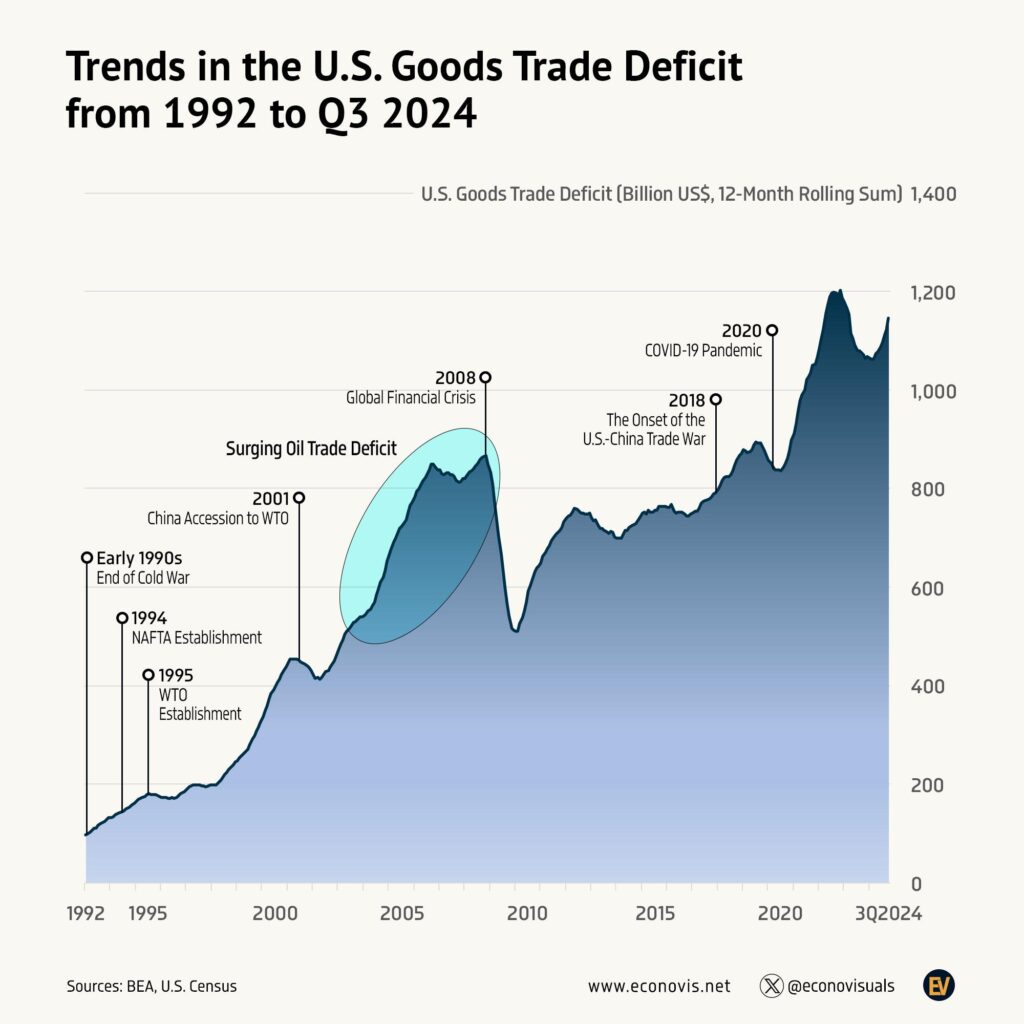
It grew from about $97 billion in 1992 to a peak of about $1.2 trillion in 2022, with sharp drops in 2001 and 2009.
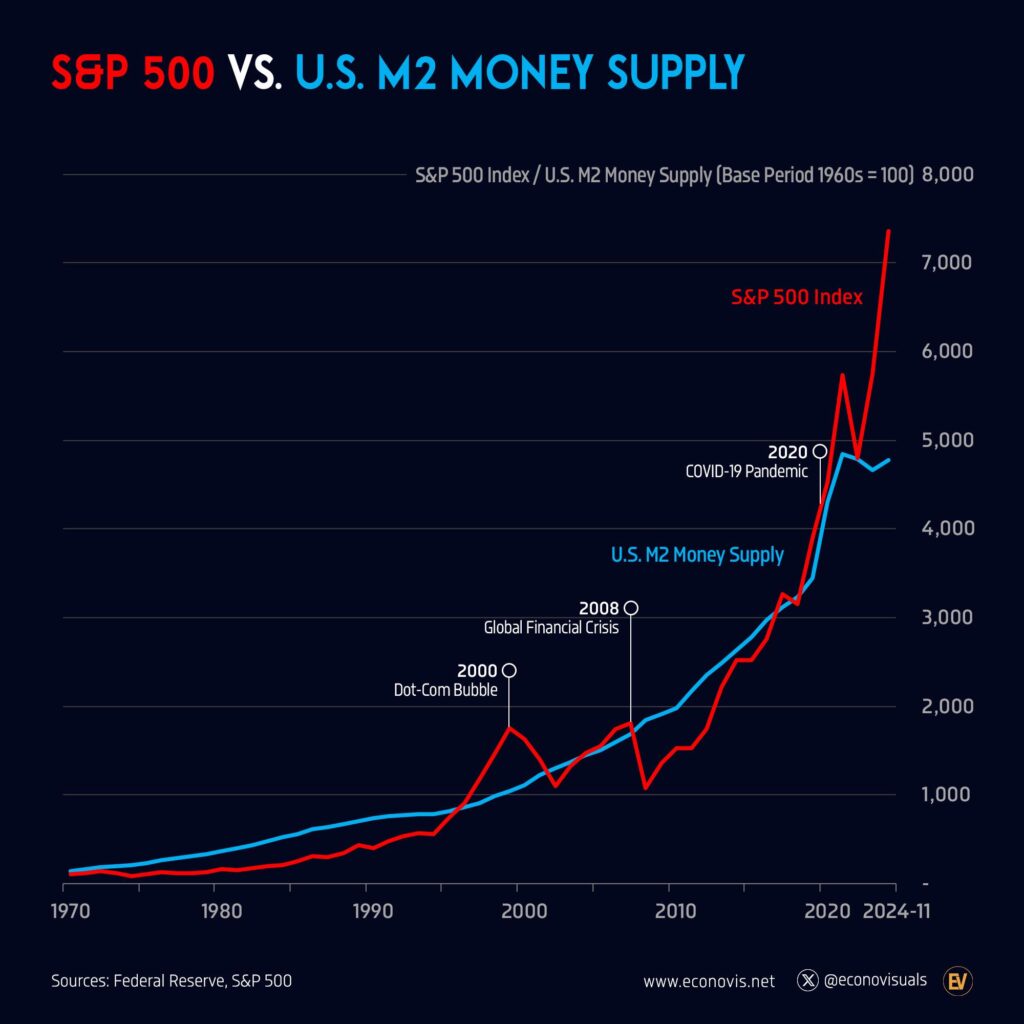
M2 money supply from 1970 to November 2024, with both rebased so the 1960s average equals 100.
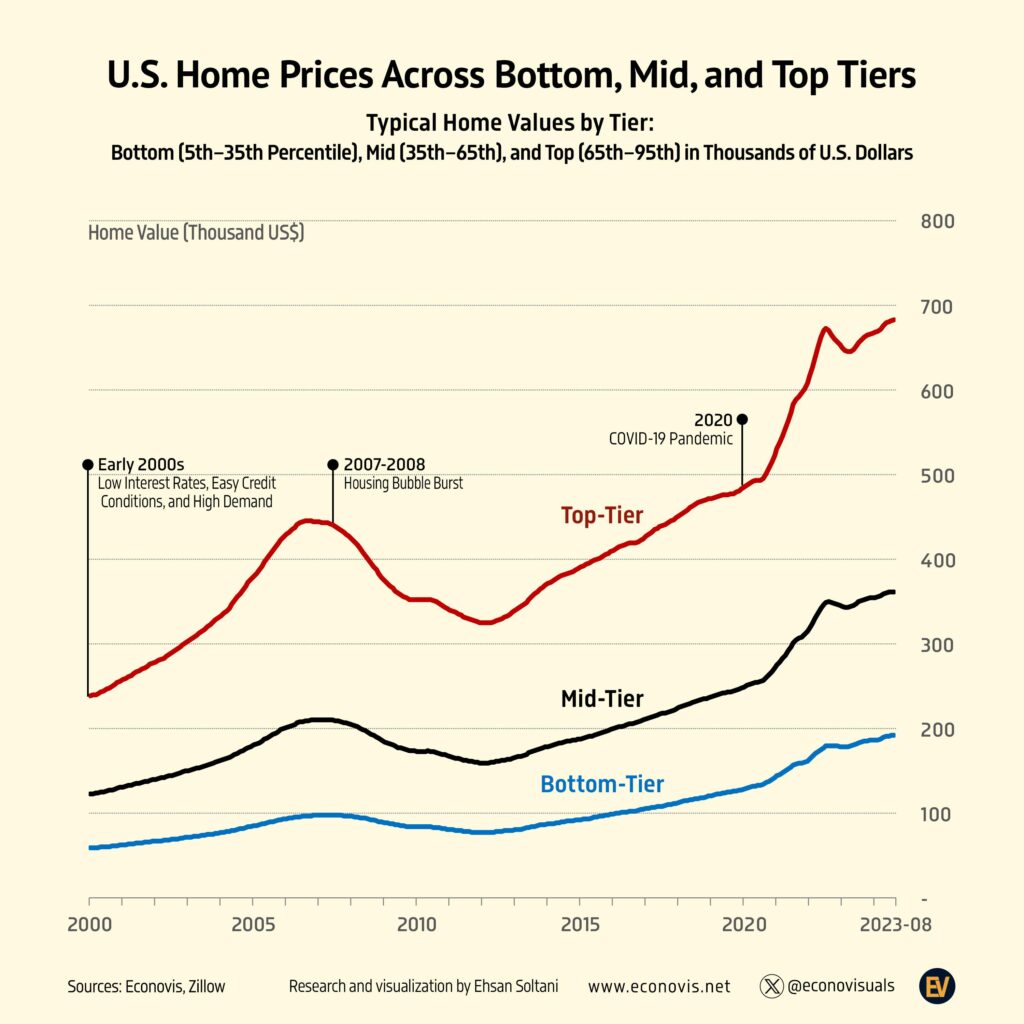
Zillow puts the typical US home at $366,157 in September 2026, up from $122,626 in January 2000, after a boom to 2007, a crash of about 24% to 2012 and a…
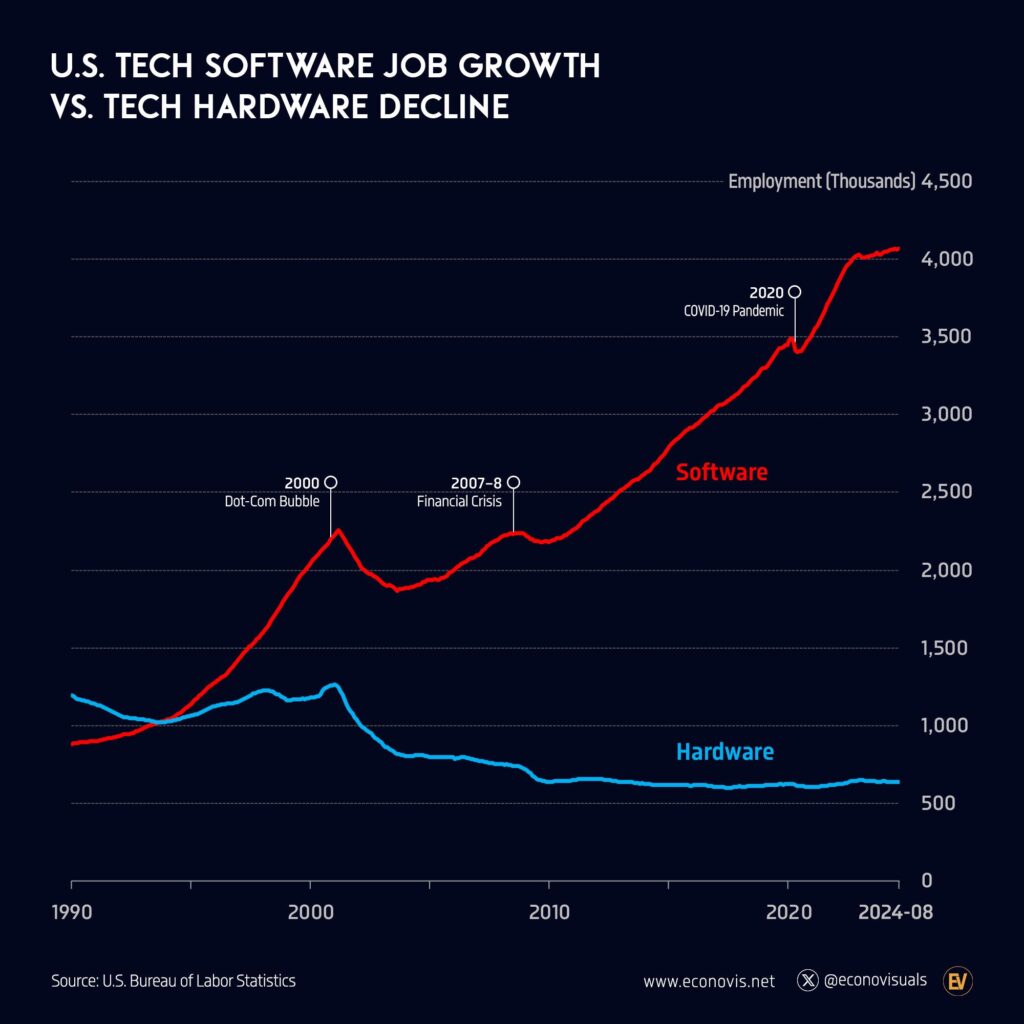
In the US they have gone opposite ways as employers: about 3.9 million tech software jobs against 556,000 in hardware manufacturing.
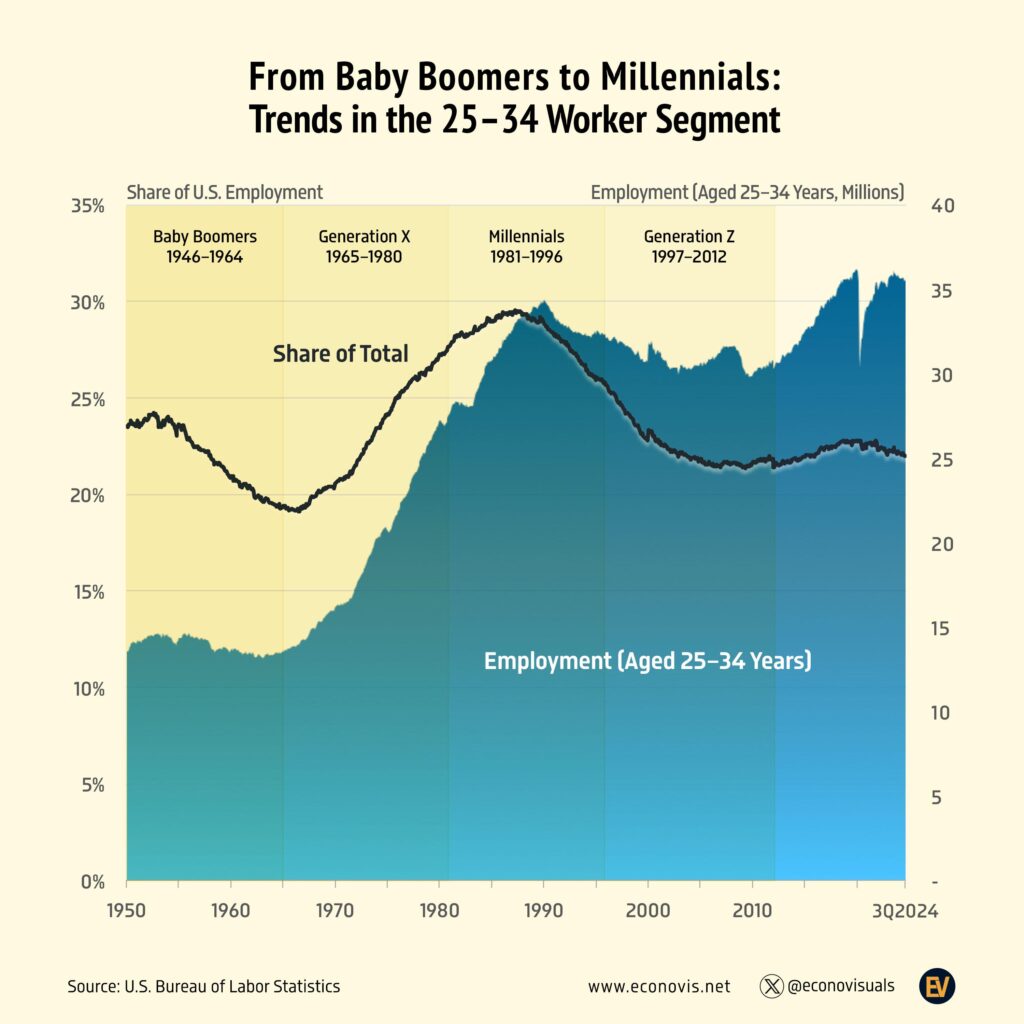
Their share of US jobs fell to 19% in the 1960s, peaked at 29% in the late 1980s as Baby Boomers reached that age, and has held near 22% since the 2000s.
Is this your work? Tell us about a credit, a correction or a better description, and we will update this page.
Give it a permanent page where people looking for your subject find it, with your name and a link to your site. Content marketers, agencies, designers and researchers all list here.