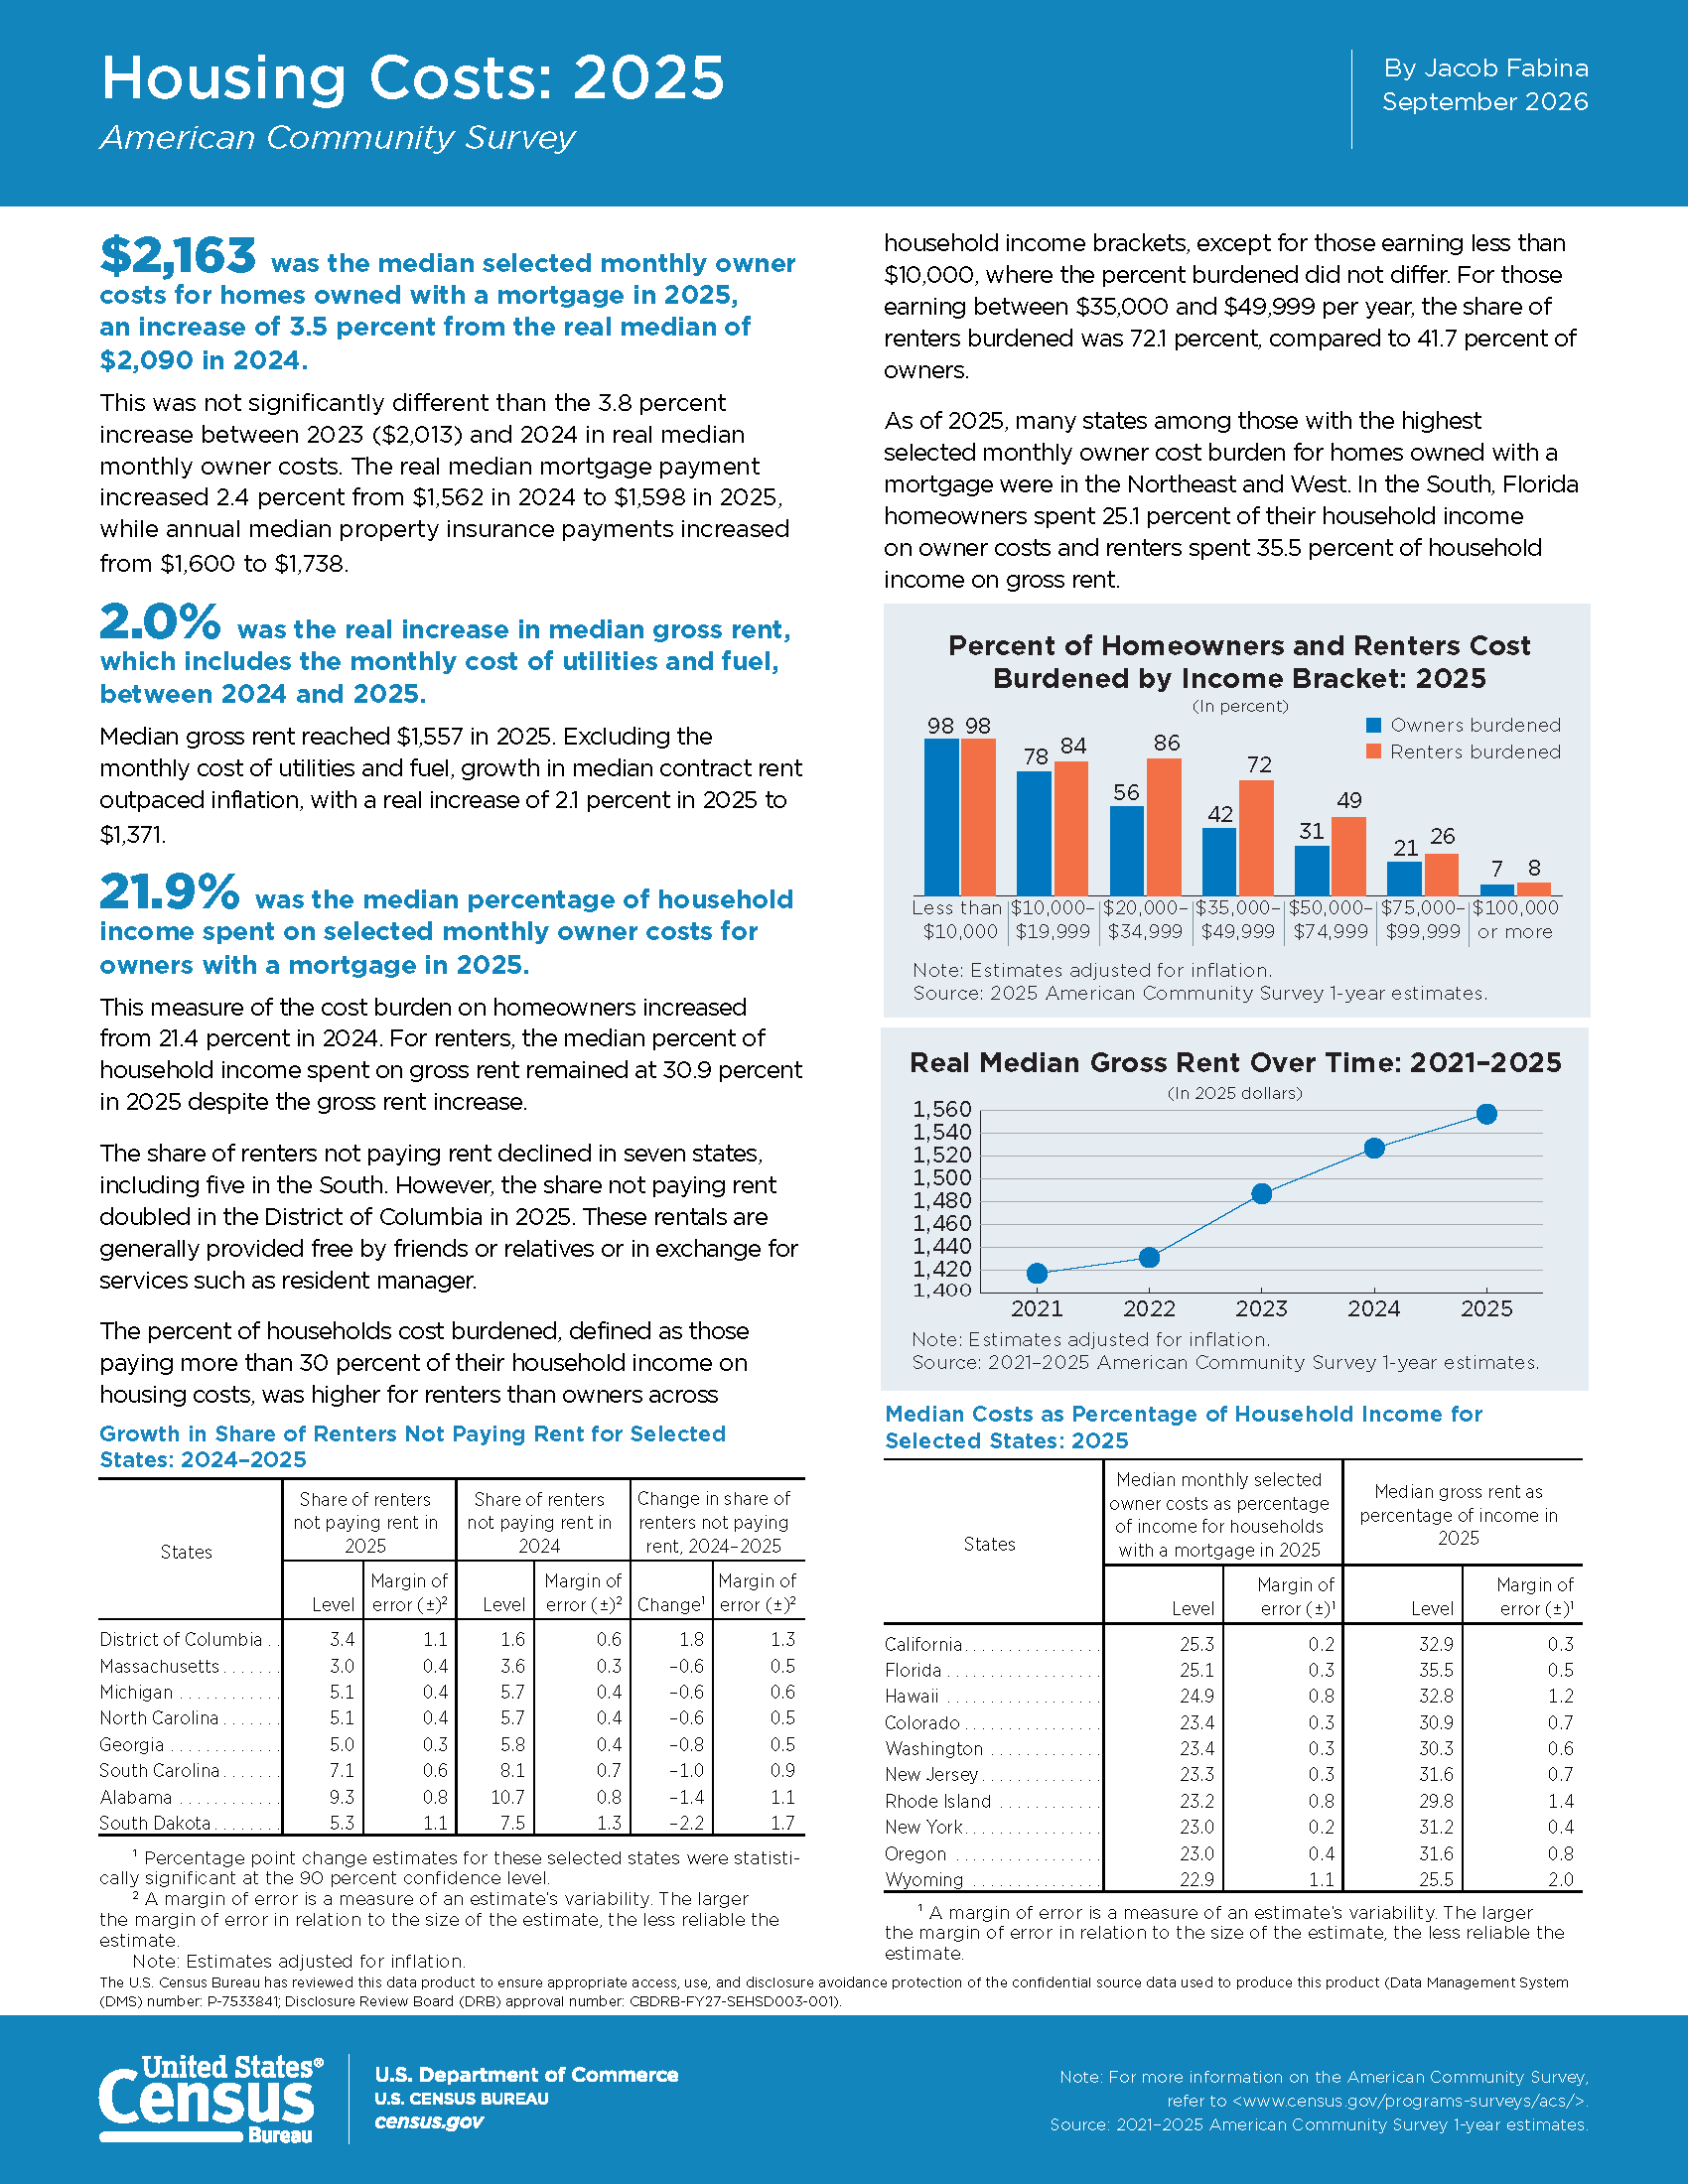
The typical US renter paid $1,557 a month for rent and utilities in 2025, and the typical homeowner with a mortgage paid $2,163 a month in mortgage, property tax, insurance and utility costs, according to the Census Bureau’s American Community Survey. Owners who have paid off their home paid $703. Renters also give up a bigger share of their income, 30.9% at the median against 21.9% for owners with a mortgage.
How much housing costs in the US
Housing in the US costs about $1,500 a month for the typical household, but what you pay depends mostly on whether you rent, own with a mortgage or own outright. Across all 134 million occupied homes, the median monthly housing cost was $1,499 in 2025, in the Census Bureau’s 2025 American Community Survey table B25105.
| Household | Median monthly cost, 2025 | What it includes |
|---|---|---|
| Renters | $1,557 | Rent plus utilities and fuel (gross rent) |
| Renters, rent only | $1,371 | Contract rent without utilities |
| Owners with a mortgage | $2,163 | Mortgage, property tax, insurance, utilities and any condo or HOA fees |
| Owners without a mortgage | $703 | The same costs with no mortgage payment |
| All households | $1,499 | Renters and owners together |
The rent figures come from table B25064 and the Census Bureau’s Housing Costs 2025 fact sheet, and the owner figures from table B25088. The mortgage payment itself is a smaller part of an owner’s bill than most people expect. The fact sheet puts the median mortgage payment at $1,598 a month in 2025, with the rest going on property tax, insurance and utilities. The median annual property insurance bill rose from $1,600 to $1,738 in a year.
About 59% of homeowners still have a mortgage, and 65.3% of US households own their home, according to the Census Bureau’s Homeownership 2025 fact sheet. The other 46.6 million households rent.
How housing costs have changed since 2019
Rent has risen faster than owner costs since before the pandemic. Median gross rent went up about 42% between 2019 and 2025, from $1,097 to $1,557, while monthly costs for owners with a mortgage went up about 34%, from $1,609 to $2,163, on the Census Bureau’s one-year survey figures (our sums, not adjusted for inflation).
| Year | Median gross rent | Owners with a mortgage | Owners without a mortgage |
|---|---|---|---|
| 2019 | $1,097 | $1,609 | $505 |
| 2021 | $1,191 | $1,672 | $539 |
| 2022 | $1,300 | $1,775 | $585 |
| 2023 | $1,406 | $1,904 | $629 |
| 2024 | $1,487 | $2,035 | $664 |
| 2025 | $1,557 | $2,163 | $703 |
There is no 2020 row because the Census Bureau didn’t publish its standard one-year estimates for 2020, when the pandemic disrupted the survey.
Costs are still rising faster than prices in general. After adjusting for inflation, the Census Bureau’s Housing Costs 2025 fact sheet reports a 3.5% real rise in owner costs for homes with a mortgage between 2024 and 2025, after a 3.8% rise the year before. Real median gross rent rose 2.0% and real contract rent 2.1%. Its chart of real gross rent shows a rise in every year from 2021 to 2025.
How much of your income goes on housing
The typical renter spends almost a third of their household income on housing, and the typical owner with a mortgage spends just over a fifth. The Census Bureau puts median gross rent at 30.9% of household income in 2025 (table B25071) and median owner costs at 21.9% for homes with a mortgage and 11.7% for homes without one (table B25092).
The usual line for affordable housing is 30% of income. HUD’s Office of Policy Development and Research defines housing affordability as households spending no more than 30% of their monthly income on housing costs, and the Census Bureau calls households above that line cost burdened. On the Census Bureau’s table B25070, 51.8% of renters paid 30% or more of their income in rent in 2025 and 26.2% paid half or more (our sums, leaving out renters whose share couldn’t be worked out). That compares with 48.4% and 23.7% in 2019. For owners with a mortgage the share at 30% or more was 30.7% in 2025, up from 26.6% in 2019 (table B25091, our sums).
Income matters far more than tenure at the bottom and the top. In the Census fact sheet’s breakdown, nearly every household earning under $10,000 a year is cost burdened, whether it rents or owns, and very few earning $100,000 or more are.
| Household income | Owners cost burdened | Renters cost burdened |
|---|---|---|
| Less than $10,000 | 98% | 98% |
| $10,000 to $19,999 | 78% | 84% |
| $20,000 to $34,999 | 56% | 86% |
| $35,000 to $49,999 | 42% | 72% |
| $50,000 to $74,999 | 31% | 49% |
| $75,000 to $99,999 | 21% | 26% |
| $100,000 or more | 7% | 8% |
The biggest gap is in the middle. For households earning $35,000 to $49,999, the Census Bureau found 72.1% of renters were cost burdened against 41.7% of owners.
Housing costs by state
California has the highest housing costs of any state for renters, and Washington, D.C. is higher still for owners with a mortgage. West Virginia is the cheapest state on both measures. These are 2025 medians from the Census Bureau’s state tables for gross rent and owner costs.
| Highest median rent | Per month | Highest owner costs with a mortgage | Per month |
|---|---|---|---|
| California | $2,160 | District of Columbia | $3,256 |
| District of Columbia | $2,075 | California | $3,080 |
| Hawaii | $2,009 | Hawaii | $3,025 |
| Massachusetts | $1,962 | New Jersey | $2,970 |
| New Jersey | $1,885 | Massachusetts | $2,884 |
| Lowest median rent | Per month | Lowest owner costs with a mortgage | Per month |
|---|---|---|---|
| West Virginia | $921 | West Virginia | $1,375 |
| Iowa | $1,026 | Arkansas | $1,477 |
| Mississippi | $1,033 | Mississippi | $1,499 |
| Arkansas | $1,055 | Kentucky | $1,564 |
| North Dakota | $1,071 | Indiana | $1,577 |
High costs don’t always mean the heaviest burden, because incomes differ too. Florida renters spend the most of their income on rent of any state, 35.5% at the median, and Florida homeowners with a mortgage spend 25.1%, second only to California’s 25.3%, according to the Census Bureau’s Housing Costs 2025 fact sheet. At the other end, renters in North Dakota spend 23.8% and in Wyoming 25.5% (table B25071).
Why renters feel housing costs more than owners
Renters pay less in dollars than owners with a mortgage, but they have much lower incomes, so the same costs take a bigger bite. The median renter household had an income of $57,048 in 2025, against $103,251 for owner households, in the Census Bureau’s table B25119.
Renters are also more exposed to price rises. A fixed-rate mortgage locks in the biggest part of an owner’s bill, so owner costs mainly move with property tax, insurance and utilities. Rent can reset at every renewal, which helps explain why rent grew faster than owner costs over the last six years. Renter incomes rose about 34% between 2019 and 2025 while median gross rent rose about 42% (our sums from the same Census tables), which is how the share of cost-burdened renters crept up.
A small group of renters pays nothing at all. The Census Bureau counts households living rent free, usually in a home provided by family or friends or in exchange for work such as being a resident manager. That share fell in seven states in 2025 but doubled in Washington, D.C. to 3.4%.
Questions about housing costs
What is the 30% rule for housing costs?
The 30% rule says your housing costs should take no more than 30% of your household income before tax. HUD uses it to define affordable housing, and the Census Bureau counts households paying more than that as cost burdened. For renters the costs are rent and utilities, and for owners they are the mortgage, property tax, insurance and utilities.
What is the average cost of rent in the US per month?
The median rent in the US was $1,557 a month in 2025 including utilities, or $1,371 for the rent alone, according to the Census Bureau. Rental listing sites usually quote higher figures because they track asking rents for apartments on the market now, while the Census figure covers every renting household, including people who have been in the same place for years.
Is 40% of income for housing too much?
Yes, by the usual measure. Spending 40% is well over the 30% line that HUD and the Census Bureau use, though it is common. About 35.5% of US renters paid 40% or more of their income in rent in 2025, on the Census Bureau’s table B25070 (our sums).
Is the 30% of income for housing gross or net?
It is gross income. The Census Bureau’s cost-burden figures compare housing costs with household income before tax, so 30% of your take-home pay is a stricter test than the official one.
Which state has the highest housing costs?
California, with a median rent of $2,160 a month and median costs of $3,080 a month for homeowners with a mortgage in 2025. Washington, D.C. is higher for owners, at $3,256, but it isn’t a state. West Virginia is the cheapest, at $921 for renters and $1,375 for owners with a mortgage.
Is a $2,000 a month mortgage high?
It is above average for the US. The Census Bureau puts the median mortgage payment at $1,598 a month in 2025, before property tax, insurance and utilities. To keep a $2,000 payment within the 30% rule you would need a household income of about $80,000 a year, and more once those other costs are added.
Sources
- Jacob Fabina, U.S. Census Bureau, Housing Costs 2025, American Community Survey (fact sheet, October 2026)
- U.S. Census Bureau, Homeownership 2025, American Community Survey (fact sheet, October 2026)
- U.S. Census Bureau, 2025 American Community Survey 1-year estimates, tables B25064 (median gross rent), B25088 (owner costs), B25105 (all housing costs), B25070 and B25071 (rent as a share of income), B25091 and B25092 (owner costs as a share of income), B25119 (income by tenure), with the same tables for 2019 and 2021 to 2024
- Elaine Ng, HUD Office of Policy Development and Research, Housing Affordability Across the Country (PD&R Edge, 24 July 2025)