

Housing
Housing Costs in the US, Rent and Mortgage Costs by State
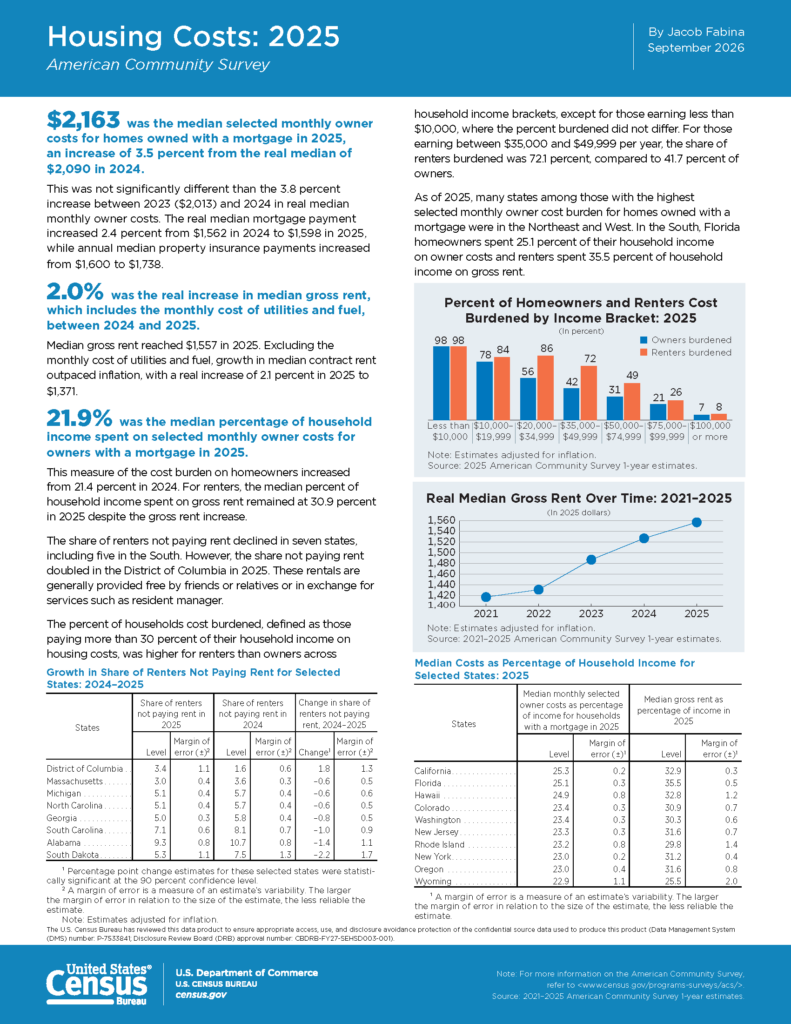
Owners who have paid off their home paid $703.
This section covers the housing market, including what homes cost, how prices compare with incomes and how many people own their home. Each page gives the full data as text, states when it was collected and links to the listing, census or statistics source. Start with the house price to income ratio by state, median home prices by state, housing affordability by state, home ownership in Europe by country or US home prices by tier. Most pages cover US states, with comparisons for Europe and Turkey.
Owners who have paid off their home paid $703.

Across the US a typical home cost about 4.8 years of per person income in 2025, and the cheapest states to buy in are in Appalachia, the Midwest, the Plains…
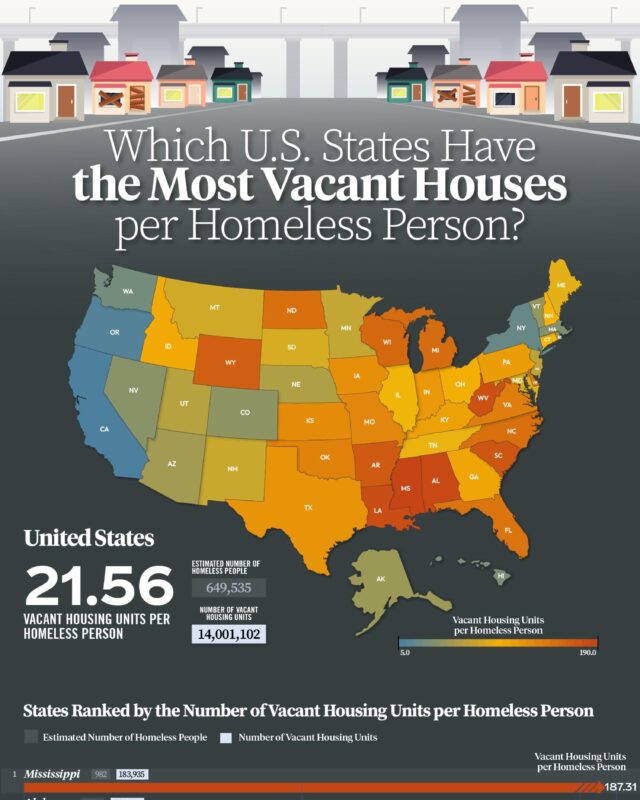
Census Bureau data shows about 14.0 million vacant housing units against 649,535 homeless people counted in January 2023, or about 21.6 vacant homes per…

On Eurostat's 2025 figures, 93.8% of people in Slovakia live in a home their household owns, followed by Romania at 93.2% and Croatia at 91.4%.

A record 1.69 million homes were sold in 2025, yet prices rose 22.3% in the year to September 2026 while inflation ran at 29.7%, a real fall of about 5.7%.

The national figure is 4.6, which means a typical US home costs about four and a half years of a typical household's gross income.

Zillow puts the typical US home at $366,157 in September 2026, up from $122,626 in January 2000, after a boom to 2007, a crash of about 24% to 2012 and a…

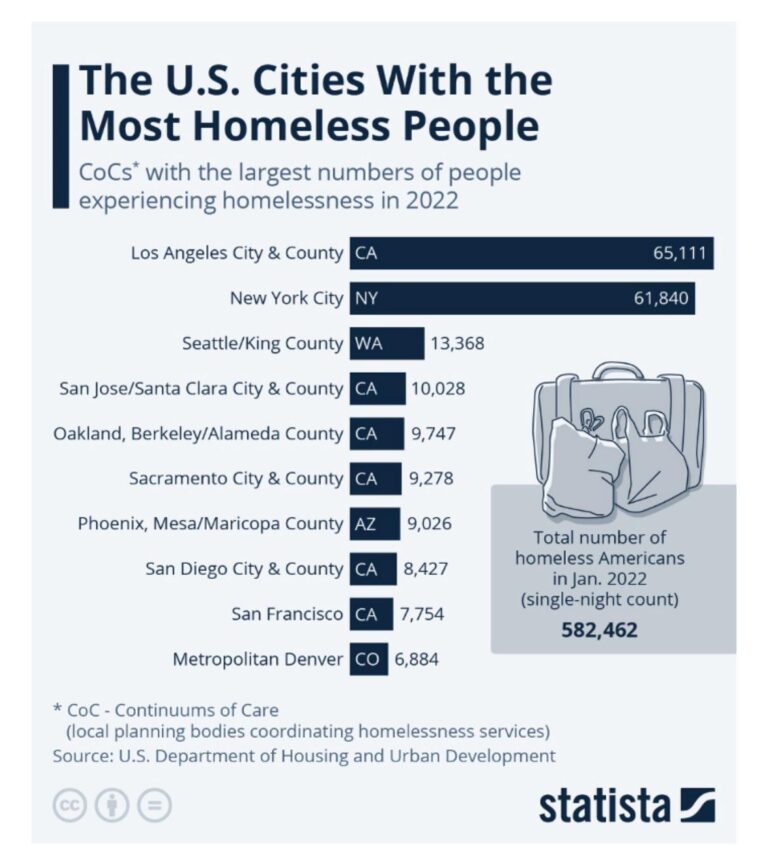
In the 2022 count shown on the Statista infographic, Los Angeles was top with 65,111.

On Realtor.com's September 2026 figures the US median listing price was $419,250, with Hawaii, California and Massachusetts the most expensive states and…
Give it a permanent page where people looking for your subject find it, with your name and a link to your site. Content marketers, agencies, designers and researchers all list here.