Key figures
- Saudi Aramco is the most profitable company on the chart with $120.7 billion.
- Apple is second with $97.0 billion and Berkshire Hathaway third with $96.2 billion, followed by Alphabet ($73.8 billion) and Microsoft ($72.4 billion).
- Finance has the most companies in the top 50 with 14, ahead of energy with 12 and technology with 8.
- Lukoil is 50th with $13.6 billion.
All figures are from the graphic, which cites Fortune, 2024.
The 50 most profitable companies in text
Title: Top 50 Most Profitable Companies 2024. The graphic is a treemap: each company is a tile sized by profit, grouped into coloured blocks for Energy, Technology, Finance, Healthcare, Auto, Retail, Telecoms and Household Products. It prints no ranks; the ranks below are from the dataset Visual Capitalist published with the graphic [1], and company names are as printed on the tiles (Apple and Volkswagen appear as logos only).
| Rank | Company | Sector on the graphic | 2024 profits |
|---|---|---|---|
| 1 | Saudi Aramco | Energy | $120.7B |
| 2 | Apple | Technology | $97.0B |
| 3 | Berkshire Hathaway | Finance | $96.2B |
| 4 | Alphabet | Technology | $73.8B |
| 5 | Microsoft | Technology | $72.4B |
| 6 | ICBC | Finance | $51.4B |
| 7 | JPMorgan Chase & Co. | Finance | $49.6B |
| 8 | China Construction Bank | Finance | $47.0B |
| 9 | Meta | Technology | $39.1B |
| 10 | Agricultural Bank of China | Finance | $38.0B |
| 11 | ExxonMobil | Energy | $36.0B |
| 12 | Johnson & Johnson | Healthcare | $35.2B |
| 13 | Toyota | Auto | $34.2B |
| 14 | Bank of China | Finance | $32.8B |
| 15 | Amazon | Retail | $30.4B |
| 16 | NVIDIA | Technology | $29.8B |
| 17 | UBS | Finance | $27.8B |
| 18 | TSMC | Technology | $27.4B |
| 19 | Bank of America | Finance | $26.5B |
| 20 | Petrobras | Energy | $24.9B |
| 21 | HSBC | Finance | $23.5B |
| 22 | UnitedHealth Group | Healthcare | $22.4B |
| 23 | TotalEnergies | Energy | $21.4B |
| 24 | Chevron | Energy | $21.4B |
| 25 | CNPC | Energy | $21.3B |
| 26 | China Merchants Bank | Finance | $20.7B |
| 27 | Stellantis | Auto | $20.1B |
| 28 | Shell | Energy | $19.4B |
| 29 | Deutsche Telekom | Telecoms | $19.2B |
| 30 | Wells Fargo | Finance | $19.1B |
| 31 | Volkswagen | Auto | $17.9B |
| 32 | Sber Bank | Finance | $17.7B |
| 33 | Fannie Mae | Finance | $17.4B |
| 34 | Visa | Finance | $17.3B |
| 35 | Petronas | Energy | $16.3B |
| 36 | Tencent | Technology | $16.3B |
| 37 | Walmart | Retail | $15.5B |
| 38 | Mercedes-Benz | Auto | $15.4B |
| 39 | Comcast | Telecoms | $15.4B |
| 40 | China Mobile Communication | Telecoms | $15.3B |
| 41 | bp | Energy | $15.2B |
| 42 | The Home Depot | Retail | $15.1B |
| 43 | Tesla | Auto | $15.0B |
| 44 | Rosneft | Energy | $14.9B |
| 45 | Novartis | Healthcare | $14.9B |
| 46 | Procter & Gamble | Household Products | $14.7B |
| 47 | China National Offshore Oil | Energy | $14.6B |
| 48 | AT&T | Telecoms | $14.4B |
| 49 | Broadcom | Technology | $14.1B |
| 50 | Lukoil | Energy | $13.6B |
Footnote: “Represents profits after tax, extraordinary credits, and non-controlling interests for company fiscal years ended on or before March 31, 2024.” Source: Fortune, 2024. Footer: Voronoi by Visual Capitalist, Where Data Tells the Story.
Why Saudi Aramco leads
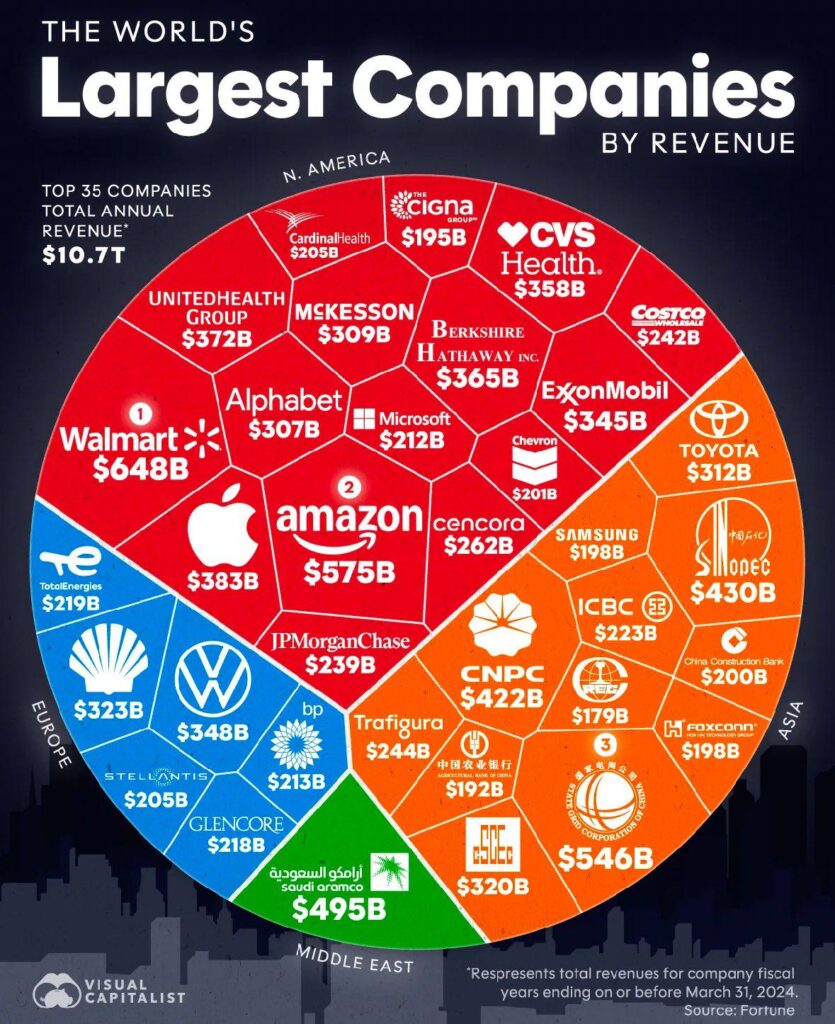
Fortune’s 2024 Global 500 put Saudi Aramco fourth by revenue, behind Walmart, Amazon and State Grid, but said that with $121 billion in profits it was the most profitable company on the list for the third year in a row [2]. Visual Capitalist links Aramco’s lead to its oil reserves, the largest proven reserves in the world, and to production costs it puts at about $3 a barrel [1]. It says Apple’s second place comes from its high margin services business and iPhone sales [1].
The 50 companies’ profits total $1509.7 billion (our arithmetic). Aramco’s $120.7 billion is close to nine times Lukoil’s $13.6 billion at 50th place.
Notes on this infographic
- “2024” refers to the Fortune list published in 2024. The profits are for fiscal years ending on or before 31 March 2024, so for most companies they are 2023 results.
- Where the graphic shows a sector name and a figure together, as with “ENERGY $120.7B”, the figure is the profit of the company in that tile (here Saudi Aramco), not a sector total.
- TotalEnergies and Chevron tie at $21.4 billion, as do Petronas and Tencent at $16.3 billion, Mercedes-Benz and Comcast at $15.4 billion, and Rosneft and Novartis at $14.9 billion. The order within each tie follows Visual Capitalist’s dataset [1].
- Fortune ranks companies by revenue; this graphic re-ranks the same list by profit.
Questions about the most profitable companies in 2024
Which company has the highest net income in 2024?
Saudi Aramco, with $120.7 billion of profits on the chart. Fortune says it was the most profitable company on its Global 500 list for the third year in a row [2].
What are the top 5 most profitable companies in 2024?
Saudi Aramco ($120.7 billion), Apple ($97.0 billion), Berkshire Hathaway ($96.2 billion), Alphabet ($73.8 billion) and Microsoft ($72.4 billion).
Which industry has the most of the world's most profitable companies?
Finance, with 14 of the top 50 companies on the chart, ahead of energy with 12 and technology with 8. The most profitable finance company is Berkshire Hathaway at $96.2 billion, followed by ICBC ($51.4 billion) and JPMorgan Chase & Co. ($49.6 billion). The graphic cites Fortune, 2024.
Why is Saudi Aramco so profitable?
Visual Capitalist puts Saudi Aramco's lead down to its oil reserves, the largest proven reserves in the world, and to production costs it puts at about $3 a barrel [1]. Fortune's 2024 Global 500 ranked Aramco fourth by revenue, but with $121 billion in profits it was the most profitable company on the list for the third year in a row [2].
Sources
- Visual Capitalist, The Top 50 Most Profitable Companies in 2024, Voronoi, 15 January 2025. The original post of this graphic, with its dataset.
- Fortune, Fortune Global 500, 2024.
Last reviewed 30 October 2026