Health and Fitness
Average ER Wait Time by State
In the latest Medicare figures, for visits in 2025, patients sent home from the emergency room spent a median of 110 minutes there in North Dakota and 293…
489 reviewed infographics. Search them, or narrow the list by topic or type and sort it the way you want.
In the latest Medicare figures, for visits in 2025, patients sent home from the emergency room spent a median of 110 minutes there in North Dakota and 293…
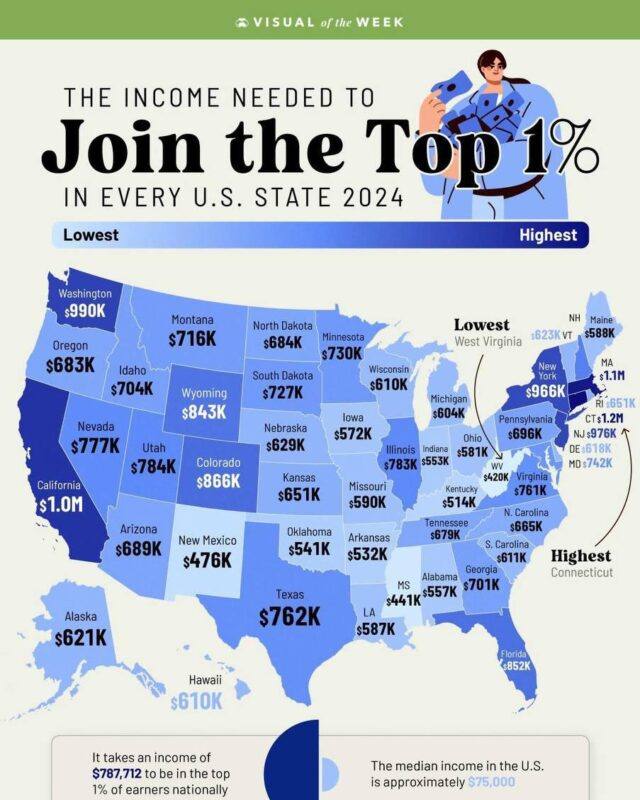
It varies widely by state, from $1,152,254 in Connecticut to $420,453 in West Virginia.

In OECD data for 2024, the countries with the highest average wages, such as Luxembourg, Switzerland, Denmark and Germany, work some of the shortest years,…

Nepal has the most, with 31 national public holidays in 2018, followed by Cambodia (30), Sri Lanka (28) and Iran (26).
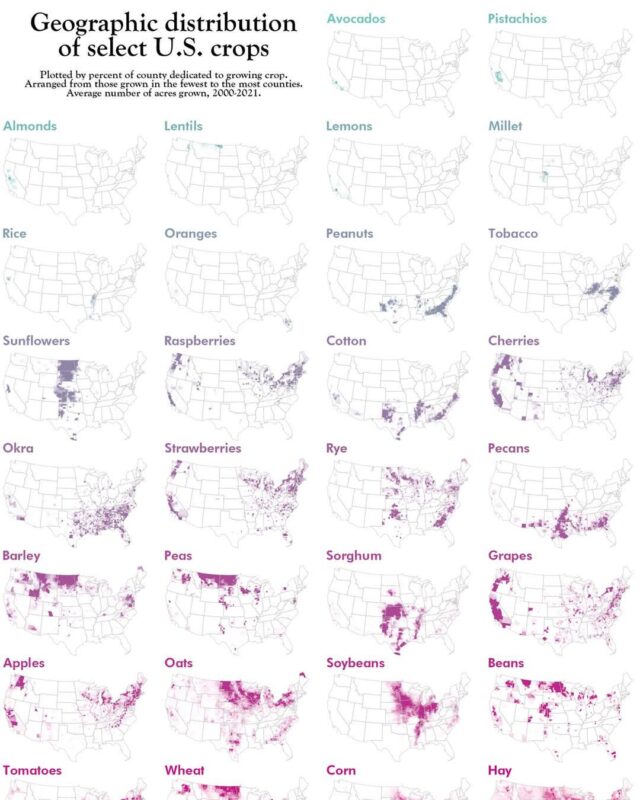
In 2025 corn covered 91.3 million harvested acres, more than any other crop.

On Eurostat's 2025 figures, 93.8% of people in Slovakia live in a home their household owns, followed by Romania at 93.2% and Croatia at 91.4%.
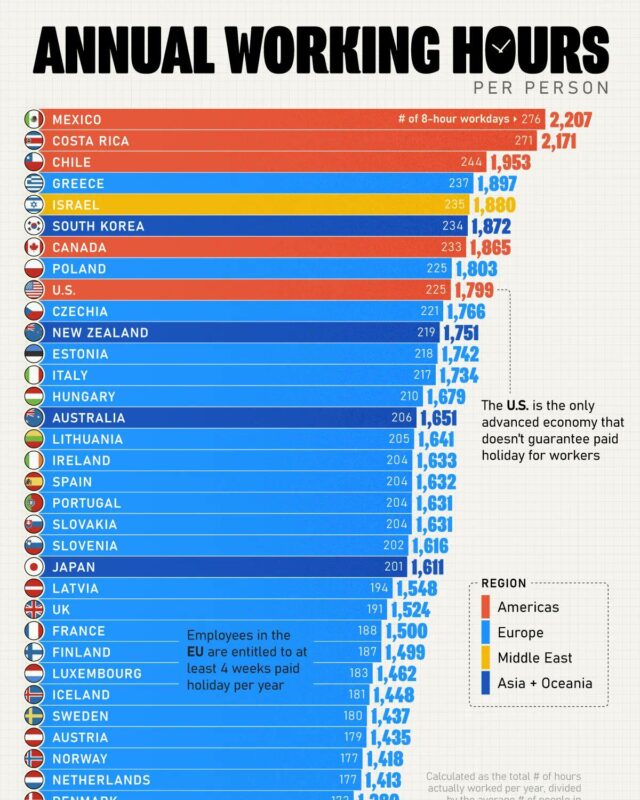
On the latest OECD figures, for 2025, people in work in Mexico put in 2,205 hours a year, the most of any OECD country, followed by Costa Rica at 2,183 and…

The United States is second at 5.0 billion tonnes and India third at 3.2 billion.

Worldwide, UNESCO counts primary age as roughly 6 to 11, and children of that age are the most likely to be in school.

It exported $168 billion of food in 2023 on World Trade Organization figures, ahead of Brazil at $143 billion, the Netherlands at $118 billion and Germany…

In 2024 İstanbul had the highest GDP per capita of Turkey's 81 provinces, at about $24,450, while Şanlıurfa had about $5,730, less than a quarter as much.

It exported $121 billion of medicines and pharmaceutical products in 2023 on WTO figures, ahead of Switzerland at $100 billion and the United States at $93…

On a US religion map by county, two groups cover most of the country.
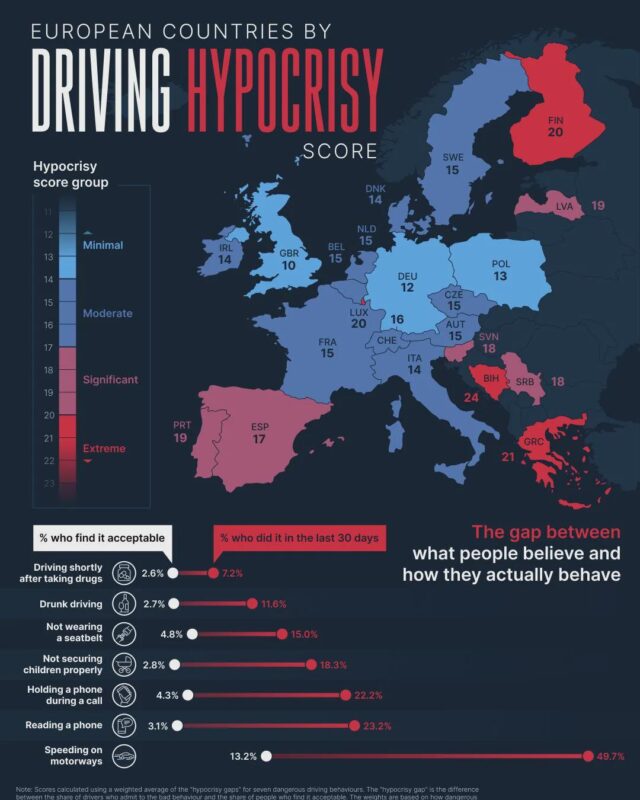
Greece (21), Finland and Luxembourg (20 each) follow.

The true size of Africa is about 30.3 million km², a fifth of the world's land and big enough to hold the United States, China, India, Japan and the whole…

Ultraviolet by Paul Pairet in Shanghai is second at about $1,230, and Caviar Russe in New York third at $975, according to Chef's Pencil's study of more…

Air rises and drops heavy rain near the equator, sinks and keeps the subtropics dry around 30 degrees north and south, and rises again in the stormy…
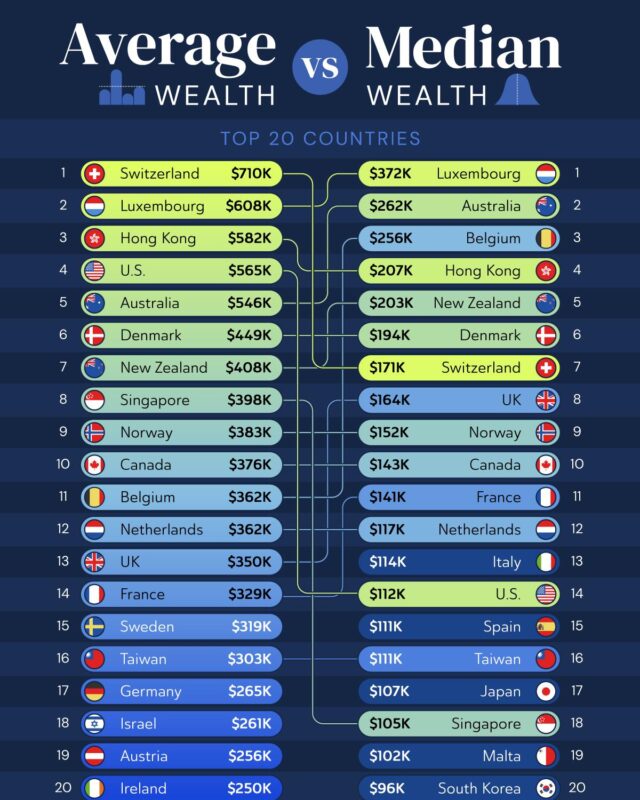
Switzerland has the highest average wealth, at about $910,000 per adult, but is only eighth for median wealth.
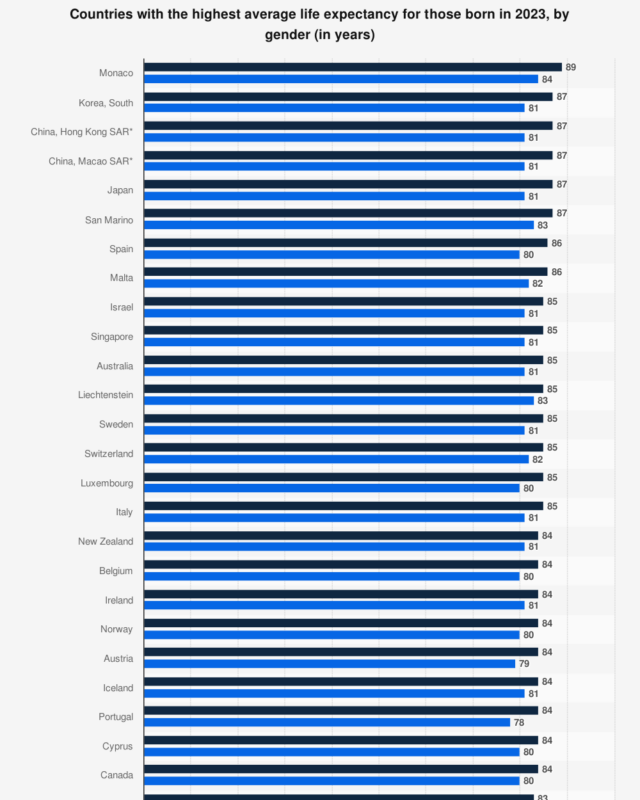
San Marino, Hong Kong, Liechtenstein, Switzerland and Japan follow at around 84 to 86 years.

The national figure is 4.6, which means a typical US home costs about four and a half years of a typical household's gross income.

Most of the food on an American Thanksgiving table comes from a small number of states.

Since 2018, growth has been concentrated in Texas, Florida, the Southeast and the Mountain West, while California's big coastal metros and several Northeast…

Women outnumber men in 23 of the 27 EU countries.

Russia had the highest rate of cat ownership at 57%.
Every topic page starts with a short guide to the subject.