History
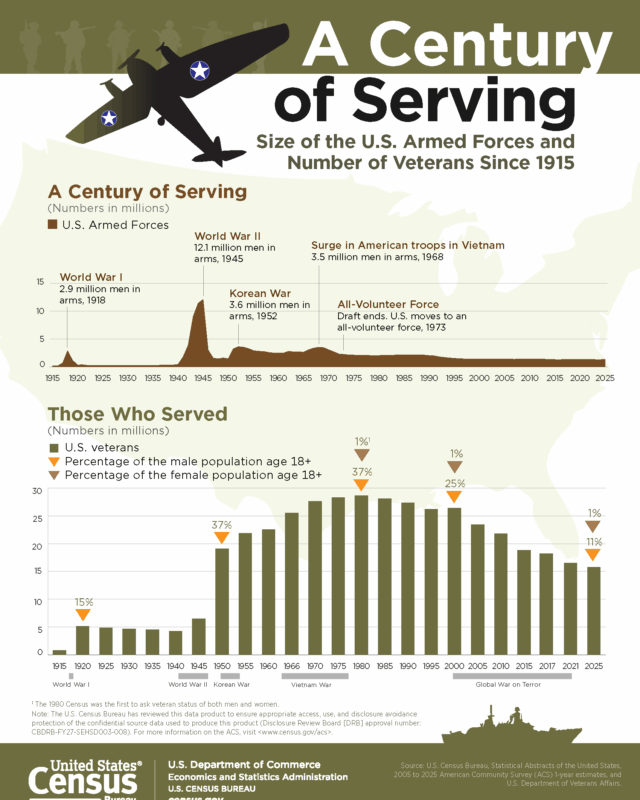
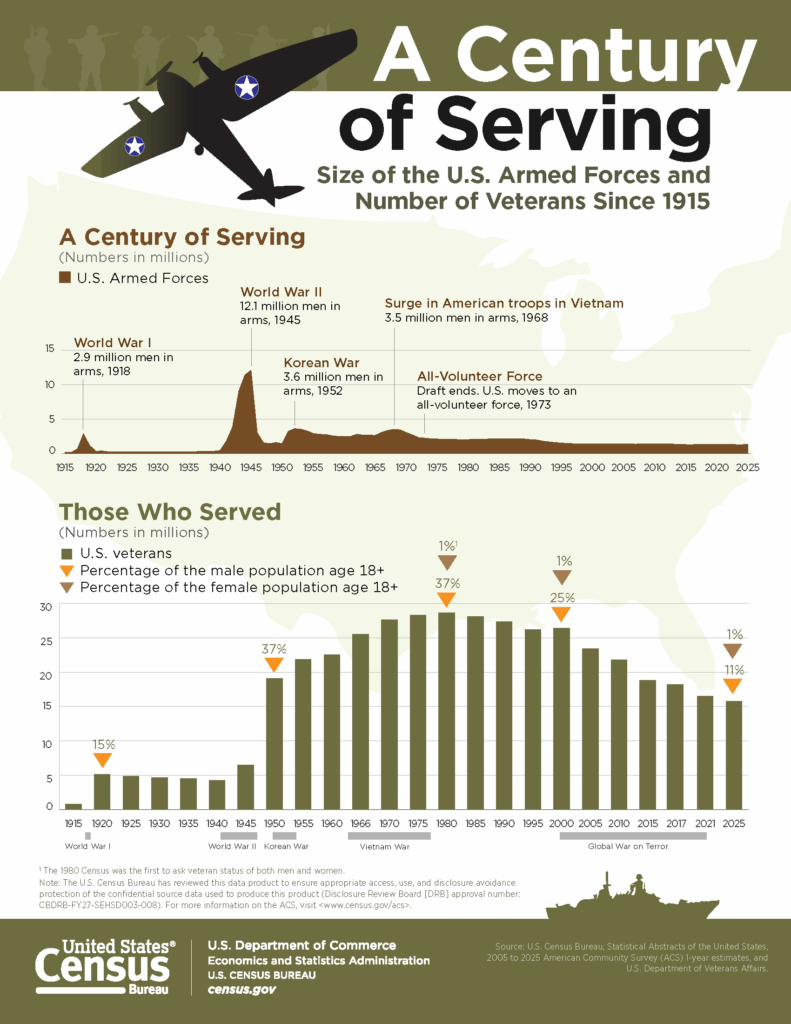
How Many Veterans Are in the US, and Military Size Since 1915
The Department of Veterans Affairs puts the figure higher, at about 17.6 million.
489 reviewed infographics. Search them, or narrow the list by topic or type and sort it the way you want.
The Department of Veterans Affairs puts the figure higher, at about 17.6 million.

The National Hurricane Center counted 284 hurricanes striking the US mainland from 1851 to 2010, about five every three years, and 96 of them were major…

Between 34% and 48% of eligible Americans stayed home each time, and no winner has received more than about 34% of the eligible population.

At the end of September 2026 China's broad money stood at RMB359.63 trillion, about $53.6 trillion at the Federal Reserve's average exchange rate for that…

Russia is the largest supplier, sending 2.19 million barrels a day in 2024, ahead of Saudi Arabia, Malaysia and Iraq.

It supplied about 72% of real GDP growth from 1990 to 2024 and added to growth in 33 of those 35 years.

Historical music charts in the US go back to 1913, when Billboard magazine first listed the best-selling sheet music, and the Billboard Hot 100, the main…

The city grew in booms: lower Manhattan towers before 1913, Art Deco Midtown around 1930, glass office blocks after the war, the Twin Towers in the 1970s…

David Rozado's analysis of millions of academic abstracts found that terms such as racism, sexism, homophobia, transphobia and Islamophobia were rare before…

Before deep learning took off, it doubled about every 21 months.

Franklin Roosevelt won in 1936 by 24.3 points in the popular vote and 97 points in the Electoral College.

Bank of America is second at about $350 billion, followed by Morgan Stanley ($298 billion), Goldman Sachs ($267 billion), Wells Fargo ($258 billion) and…

NHTSA's figures put 77% of pedestrian deaths in 2023 in the dark, against 19% in daylight.

Europe had half of world trade in 1970, but Asia has grown far faster and has been the biggest trading region since 2010, with about 39% of the total in…

The seven biggest US tech companies, known as the Magnificent Seven, were worth about $1.1 trillion together at the end of 2012 and $17.6 trillion at the…

In 2023 fuels and related products, mostly crude oil and gas, earned $247 billion, precious metals and stones such as gold, platinum and diamonds $127…
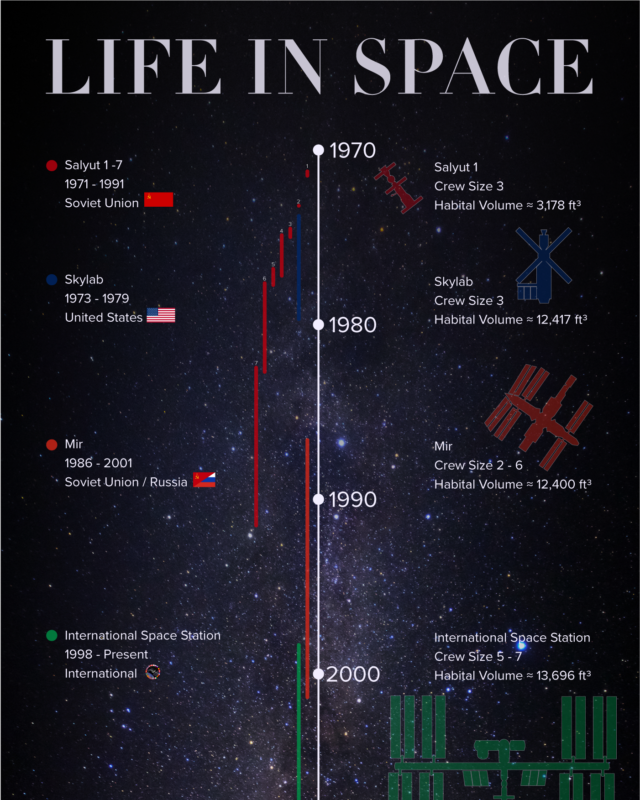
Skylab, Mir and the International Space Station followed, and people have lived in space without a break since 2 November 2000.

Over the 2021 to 2025 seasons, kickers made 98.0% of attempts under 30 yards, 93.4% from 30 to 39, 79.8% from 40 to 49, 73.4% from 50 to 54, 62.7% from 55…

Alexander Fleming found penicillin in 1928, but it only reached patients in 1943.
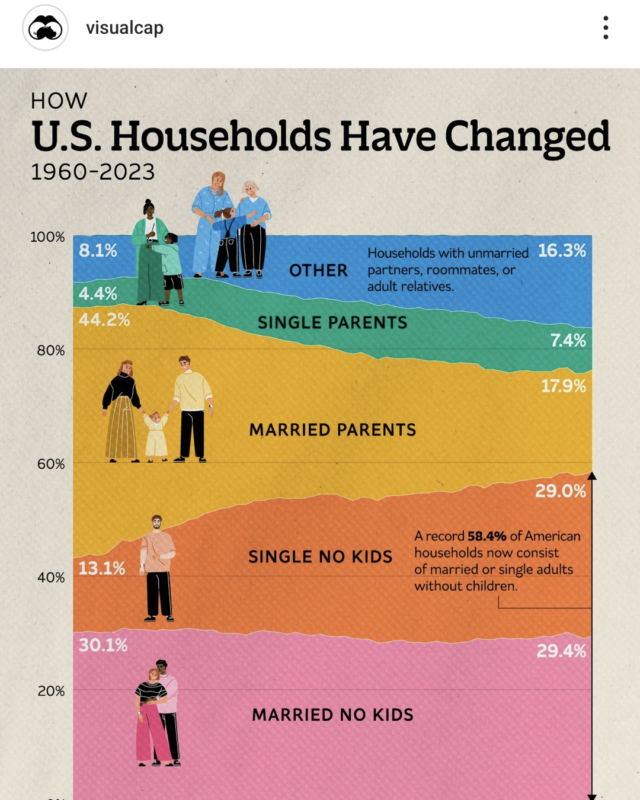
In 1960 married couples with children made up 44.2% of households.

That was a $1,259.6 billion deficit in goods, partly offset by a $327.7 billion surplus in services.

The usual ranges are the Silent Generation (born 1928 to 1945), Baby Boomers (1946 to 1964), Generation X (1965 to 1980), Millennials (1981 to 1996) and Gen…
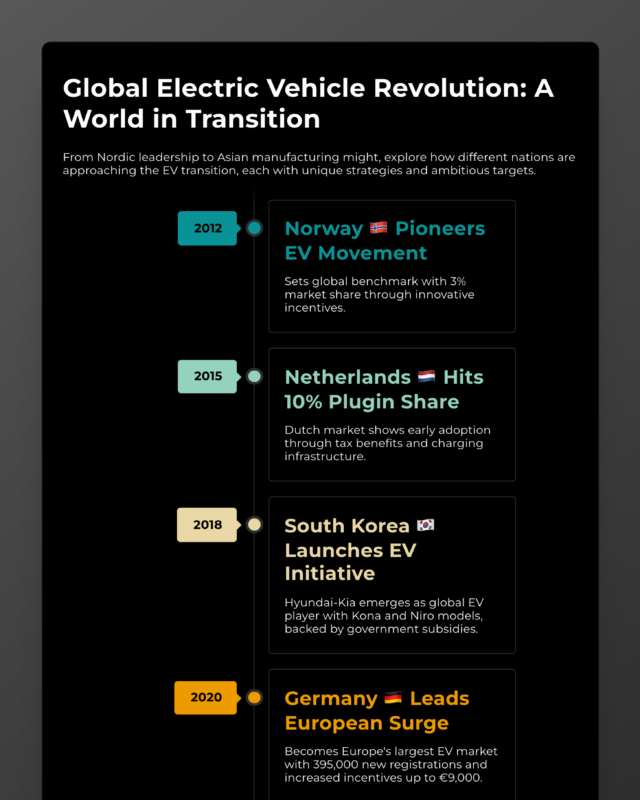
Inventors built small electric carriages in the 1830s, the first practical electric cars appeared in the 1880s, and around 1900 they were common in cities.

European Union exports to the US came to €554.7 billion of goods in 2025, about 21% of everything the EU sells outside the bloc, which makes the US its…
Every topic page starts with a short guide to the subject.