Internet and Social Media
Reddit Users by State, Measured by State Subreddit Members
In August 2024 Vermont's subreddit had members equal to 15.3% of its population, the highest of any state, followed by Alaska at 13.4% and Hawaii at 9.6%.
489 reviewed infographics. Search them, or narrow the list by topic or type and sort it the way you want.
In August 2024 Vermont's subreddit had members equal to 15.3% of its population, the highest of any state, followed by Alaska at 13.4% and Hawaii at 9.6%.

National Geographic's map of each state's 25 most common surnames shows English and Welsh names across the South and East, German and Scandinavian names in…

In Ipsos' 28-country survey, 78% of adults in China and 76% in Saudi Arabia said AI products have more benefits than drawbacks, against 35% in the US and…

At Paris 2024 Hong Kong paid the most, HK$6 million (about $768,000) for a gold medal, followed by Singapore at S$1 million (about $745,000).

Wyoming had the most at 3.82 visits per resident, followed by Washington, DC and Ohio, while Hawaii had the fewest at 0.60.

In the UK the average is 178.2 cm (5 ft 10 in) and in the US 176.9 cm (5 ft 9.7 in).

It varies widely by country: about 163.9 cm (5 ft 4.5 in) in the UK, 163.3 cm (5 ft 4.3 in) in the US, 170.4 cm in the Netherlands, the tallest, and 150.9…

West Virginia, New Mexico, Kentucky, Arkansas and Alabama are also above 15%.

Relative to the size of their economies, the UAE attracted the most, scoring 14.8 on fDi Intelligence's greenfield FDI performance index, ahead of…

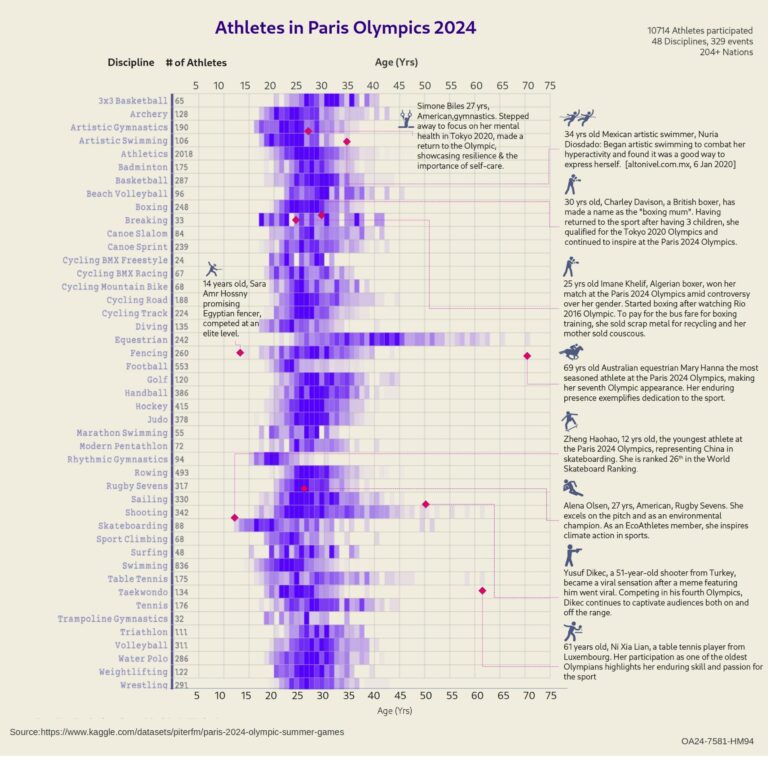
The United States sent the largest team with 592, ahead of host nation France with 573 and Australia with 459.

Global natural gas production was about 392.7 billion cubic feet a day in 2023, roughly 4,060 billion cubic metres a year, and reached 4.34 trillion cubic…
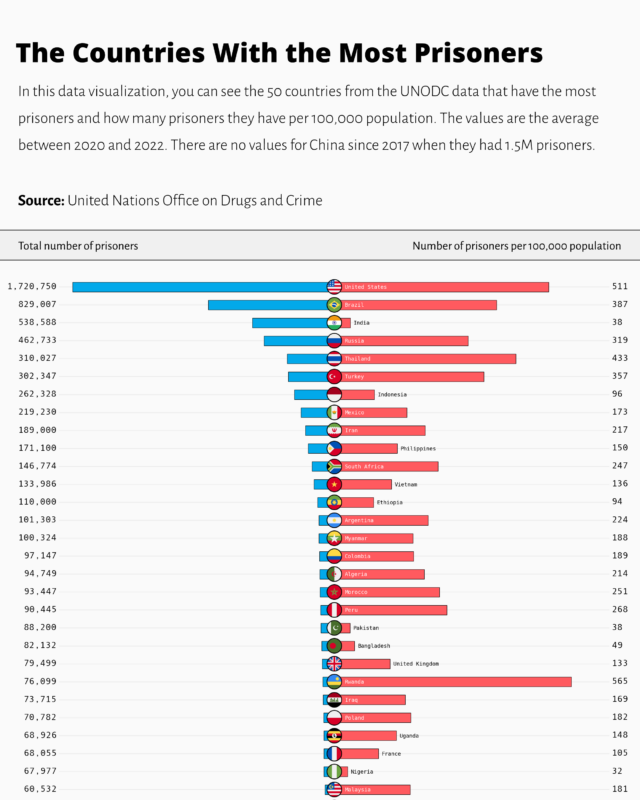
The United States also holds the most prisoners, about 1.83 million, ahead of China and Brazil.

Germany, Japan, South Korea, Vietnam, Taiwan, India and Ireland complete the top ten, and the 27 EU countries together supplied more than any single country.

Goods alone ran a deficit of about $1.2 trillion.

In 2021 the United States held 61% of chip design by value, Taiwan held 47% of fabrication against 27% for the US and 12% for China, and assembly, testing…

The United States has by far the most, about 23.6 million or 41% of the total, followed by China, Japan, Germany and the UK.
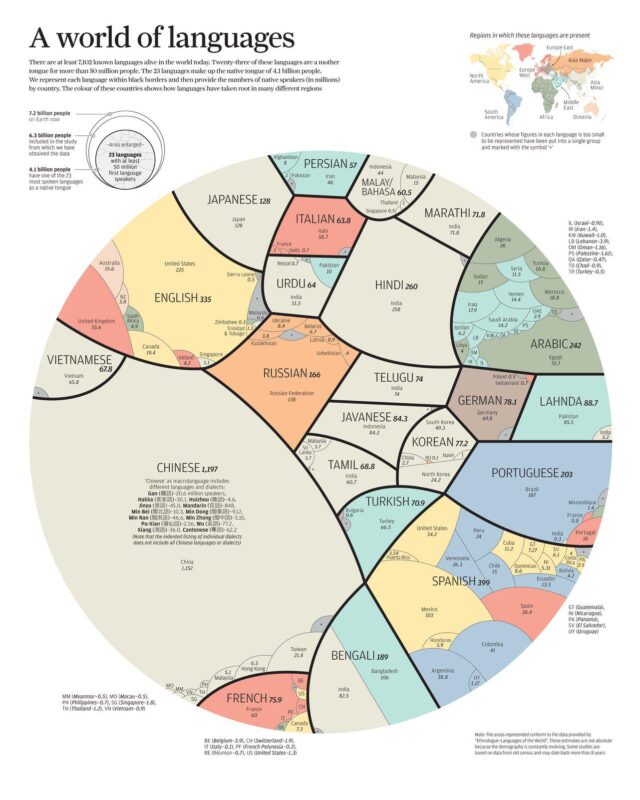
The 20 largest are the native tongue of more than 3.7 billion people.

Most states close bars at 2:00 a.m.: 30 states and Washington, DC, on VinePair's 2022 map.
Every topic page starts with a short guide to the subject.