Environment and Energy
Largest Oil Reserves by Country, the Top 10 Ranked
Energy Information Administration figures, followed by Saudi Arabia with 267 billion and Iran with 209 billion.
489 reviewed infographics. Search them, or narrow the list by topic or type and sort it the way you want.
Energy Information Administration figures, followed by Saudi Arabia with 267 billion and Iran with 209 billion.

State rates range from about 26% in Colorado to almost 40% in Alabama, and the states with the most gyms per person, such as Massachusetts and Colorado,…

Africa is close behind, while Europe and North America show smaller falls, partly because much of their wildlife was lost before 1970.
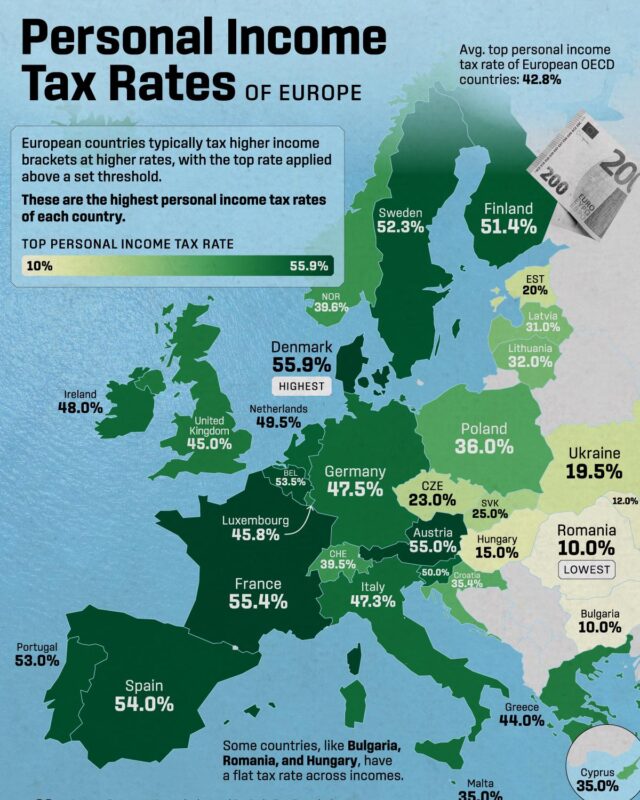
Denmark has the highest top rate of income tax at 60.5% in 2026, Belgium takes the most from an average worker's pay at 50.8%, and Hungary charges the…
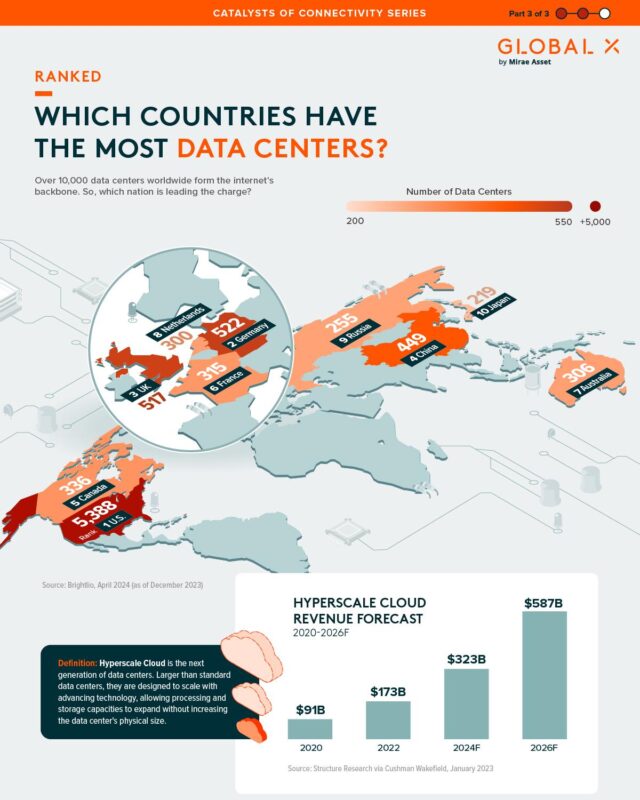
Germany (529), the United Kingdom (523), China (449) and Canada (337) follow.

In 2025 the median household in Massachusetts had $118,500 a year, about twice the $57,840 in Mississippi, against a US median of $87,460.

This Visual Capitalist map shows the 2024 figures, when the range was $178K to $301K.

In 2025 ten countries were net contributors, led by Germany at about 21.8 billion euros, while Romania, Poland and Belgium were the largest net beneficiaries.
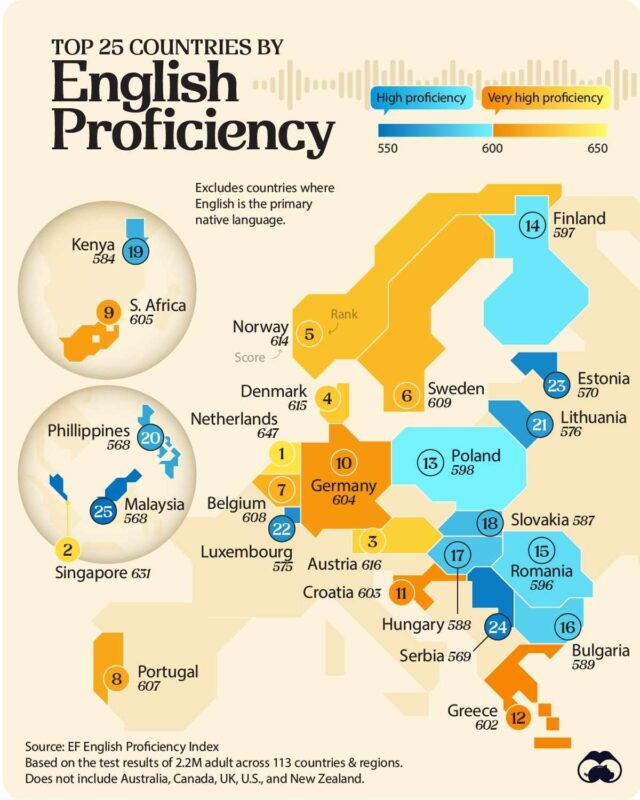
It is first in the EF English Proficiency Index 2025 with a score of 624, ahead of Croatia (617), Austria (616), Germany (615) and Norway (613).

New Hampshire (278.9) and Minnesota (278.8) score highest, and New Mexico and Louisiana (251.5) lowest, against a US average of 263.5.

This world trade infographic by Econovis shows how much each country relies on services: Luxembourg (90%), Malta (88%) and the Bahamas (86%) most, big goods…
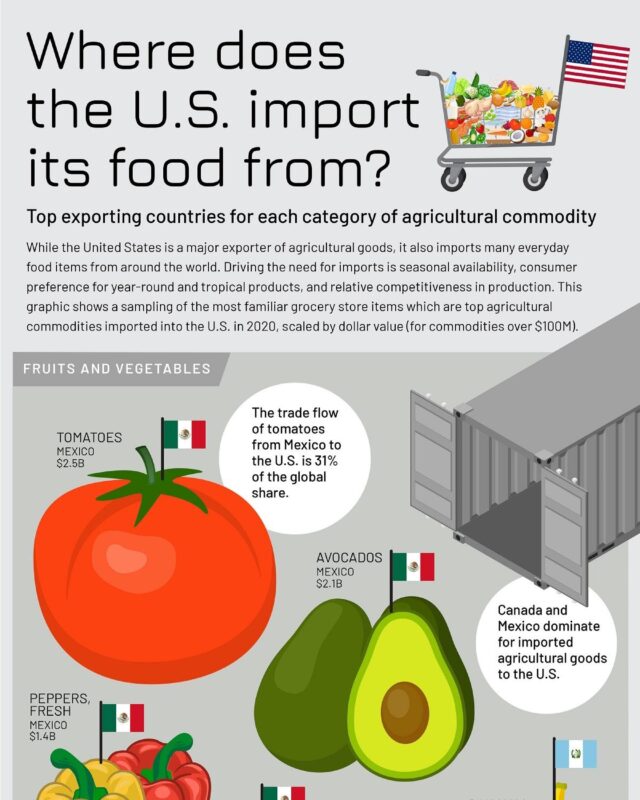
US agricultural imports reached $212 billion in 2025.

Massachusetts and Minnesota are close behind New Hampshire, Louisiana and Mississippi are near the bottom, and every state sits inside the average IQ range…

World output is 3.7 times its 1967 level, but it has been flat since a 2021 peak, with China's output falling, India growing fast and the older producers in…

The IMF projects world growth of 3.1% in 2026, with India the fastest growing large economy at 7.0%, China 4.5%, the US 2.3% and the UK 1.3%.

The world rate was 43.6% in 2024.

In 1990, 93.5 of every 1,000 children worldwide died before their fifth birthday; by 2024 it was 37.4, a fall of about 60%.

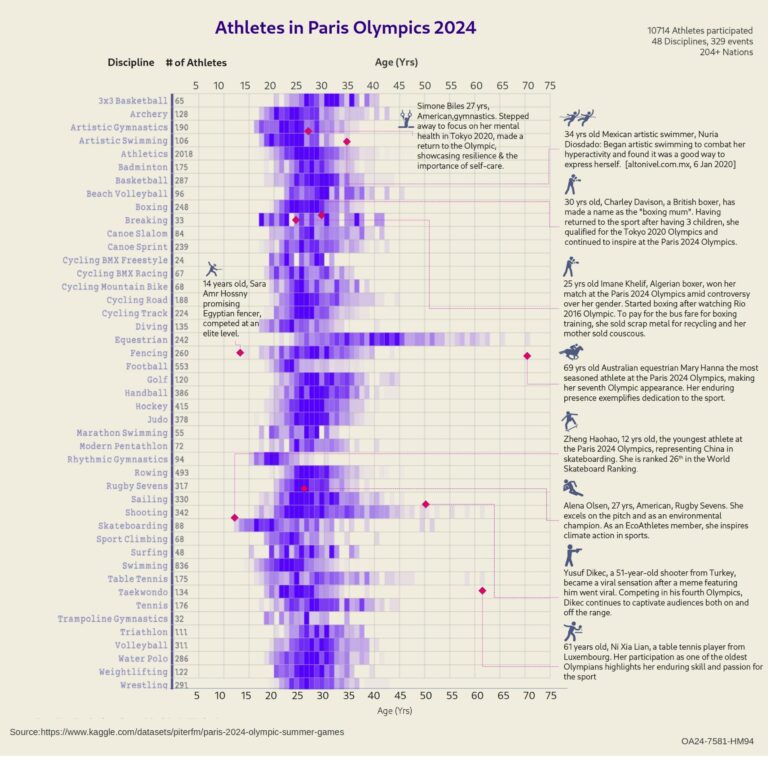
The United States sent the largest team with 592 athletes, followed by host nation France with 573, Australia with 459 and Germany with 428.

UncannyXmen.net's 2009 relationship chart maps about 240 Marvel characters by romance, from one-sided crushes to marriages.

Wyoming's was the smallest at 35,000.

In 2025 California's GDP of $4.30 trillion was close to Japan's and bigger than the UK's, Texas at $2.93 trillion out-produced Russia, Italy and Canada, and…

Between 1990 and 2023 Luxembourg grew most, by 74%, followed by Cyprus, Turkey, Andorra and Iceland, while Moldova lost 31% of its people, followed by…

On Realtor.com's September 2026 figures the US median listing price was $419,250, with Hawaii, California and Massachusetts the most expensive states and…

Afghanistan came last of 143 countries at 1.721, and the United States dropped out of the top 20 to 23rd.
Every topic page starts with a short guide to the subject.