

Business
Largest Companies by Market Cap Today and in 1997
Nvidia is second at about $4.01 trillion and Microsoft third at $3.88 trillion, followed by Alphabet ($3.63 trillion) and Amazon ($2.89 trillion).
This section covers shares and the companies behind them, including the biggest stocks by market capitalisation, how the US market compares with whole countries, and long term returns in the S&P 500. Every page credits the publisher, gives the figures as text and states the date they were taken, since market values change daily. Start with the top 10 US stocks compared with global stock markets, the top performing S&P 500 stocks, the S&P 500 against the M2 money supply, the growth of the Magnificent Seven or the largest US banks by market cap.
Nvidia is second at about $4.01 trillion and Microsoft third at $3.88 trillion, followed by Alphabet ($3.63 trillion) and Amazon ($2.89 trillion).

Bank of America is second at about $350 billion, followed by Morgan Stanley ($298 billion), Goldman Sachs ($267 billion), Wells Fargo ($258 billion) and…

The seven biggest US tech companies, known as the Magnificent Seven, were worth about $1.1 trillion together at the end of 2012 and $17.6 trillion at the…
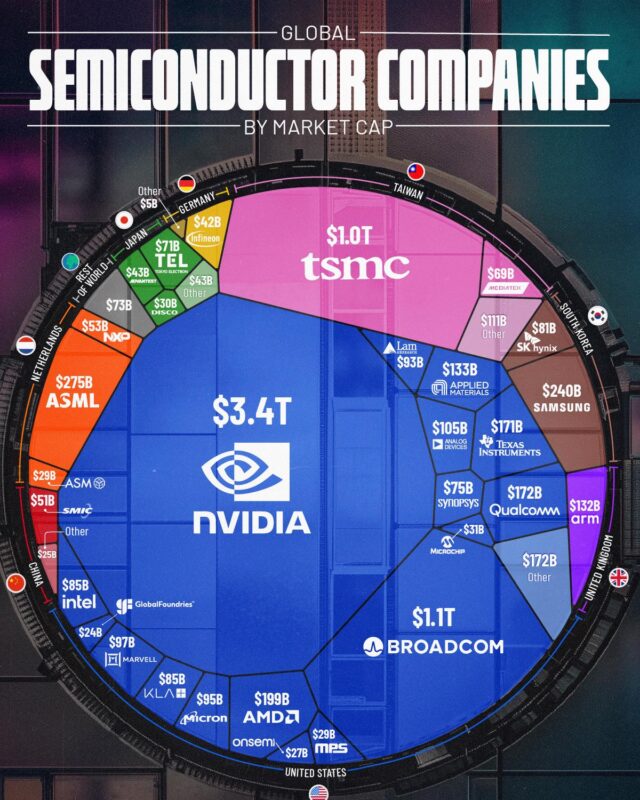
Samsung is fourth at just over $1.0 trillion, followed by Micron, AMD, SK hynix, ASML, CXMT and Intel.
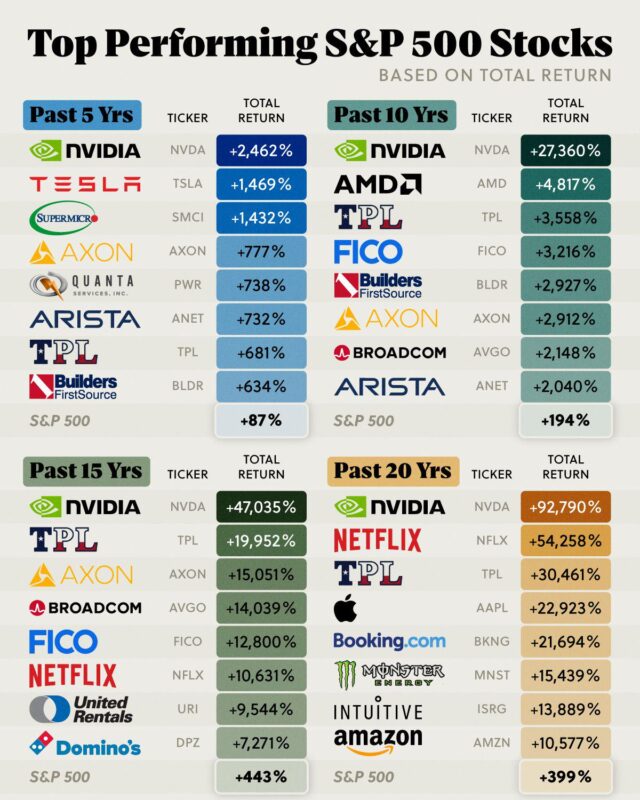
To 30 November 2024 its total return was +2,462% over five years and +92,790% over twenty, so $1,000 invested in late 2004 would have grown to about $929,000.

M2 stood at $23.41 trillion in September 2026, a record high, after rising 5.7% over the previous 12 months, according to Federal Reserve data published on…
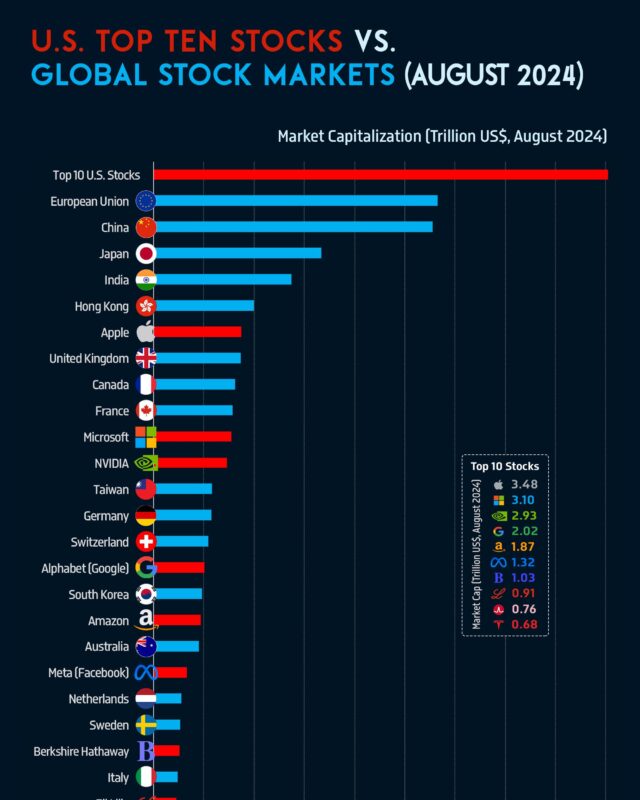
In August 2024 the ten largest US stocks were worth $18.1 trillion together, more than the whole stock market of the European Union or China.

The shares were priced at $34 on 20 March, valuing the company at about $6.4 billion, and began trading on the New York Stock Exchange as RDDT on 21 March.
Give it a permanent page where people looking for your subject find it, with your name and a link to your site. Content marketers, agencies, designers and researchers all list here.