





The 40 infographics in this collection cover trade balances and deficits, what countries export and import by product, oil and fuel flows, and long-run trends in world trade. Many follow the United States and its partners Canada, Mexico, China and the EU. Others cover food and pharmaceutical exporters, semiconductor production, steel output, Africa's exports and foreign direct investment.
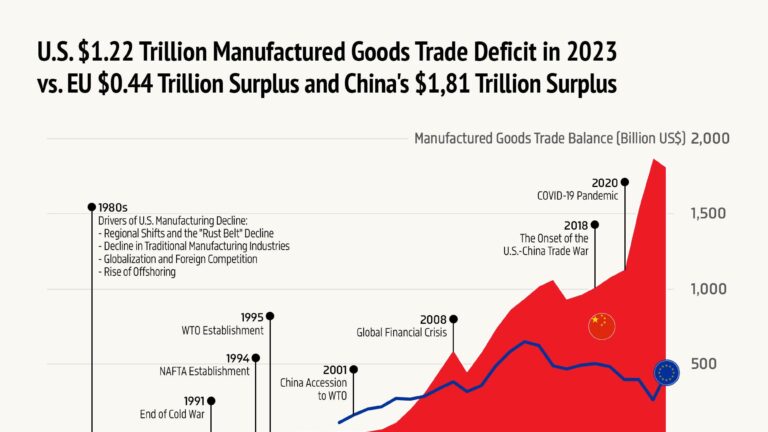
For the overall US position, the US Trade Balance Infographic, Goods and Services to 2024 by Ehsan Soltani of Econovis shows a $879 billion total deficit in the 12 months to November 2024. That is a $1,171 billion goods deficit, partly offset by a $292 billion services surplus. Global Trade Imbalance, Largest Surpluses and Deficits from World Charts adds up trade balances from 2000 to 2023. It puts the United States on a cumulative deficit of about $19.5 trillion and China on a surplus of about $7.5 trillion.
Two pieces cover US trade with its neighbours. Top US Imports 2023 by Country, Map of Leading Exporters, also by Ehsan Soltani, puts Mexico first at $480 billion, just ahead of China ($448 billion) and Canada ($431 billion). The Econovis chart US Mexico Trade 1990 to 2024, Exports, Imports and Deficit shows the US importing US$498 billion of goods from Mexico in the 12 months to September 2024 and exporting US$333 billion, a US$165 billion deficit.
On oil, the Econovis map China Oil Imports by Country, Crude Oil Sources in 2024 shows China buying 4,057 million barrels of crude in 2024. Russia was the largest supplier at 803 million barrels, 19.8% of the total. In Semiconductor Production by Country and Stage in 2021, Trendline gives the United States 61% of chip design and Taiwan 47% of fabrication.
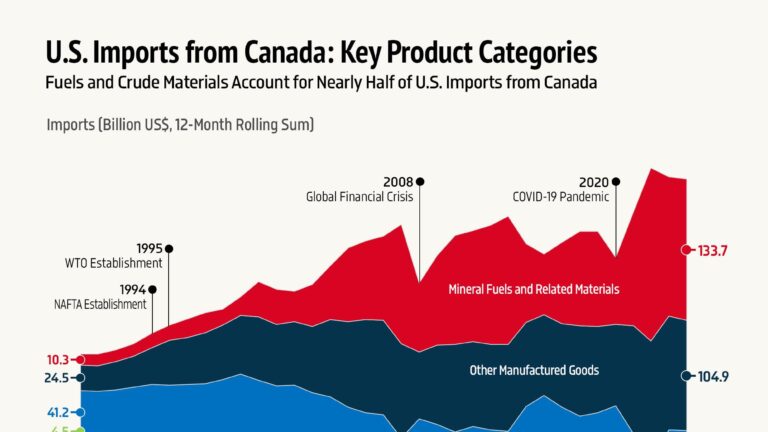
For a product breakdown, US imports from Canada shows mineral fuels leading at $133.7 billion in the 12 months to September 2024, ahead of other manufactured goods and machinery and transport equipment.
The United States, with US$168 billion of food exports in 2023 according to the Econovis map Largest Food Exporter in the World, Food Exports Map 2023. Brazil was second at US$143 billion and the Netherlands third at US$118 billion.
Germany was the largest exporter of pharmaceuticals in 2023 at $121 billion, ahead of Switzerland at $100 billion and the United States at $93 billion, according to an Econovis map based on WTO data.
China. In the Econovis chart US Trade Deficit 2024 by Country, First Half Goods Balance, by Ehsan Soltani, the US goods deficit with China for January to June 2024 was $127.7 billion. Mexico ($82.7 billion) and Vietnam ($56.6 billion) came next.