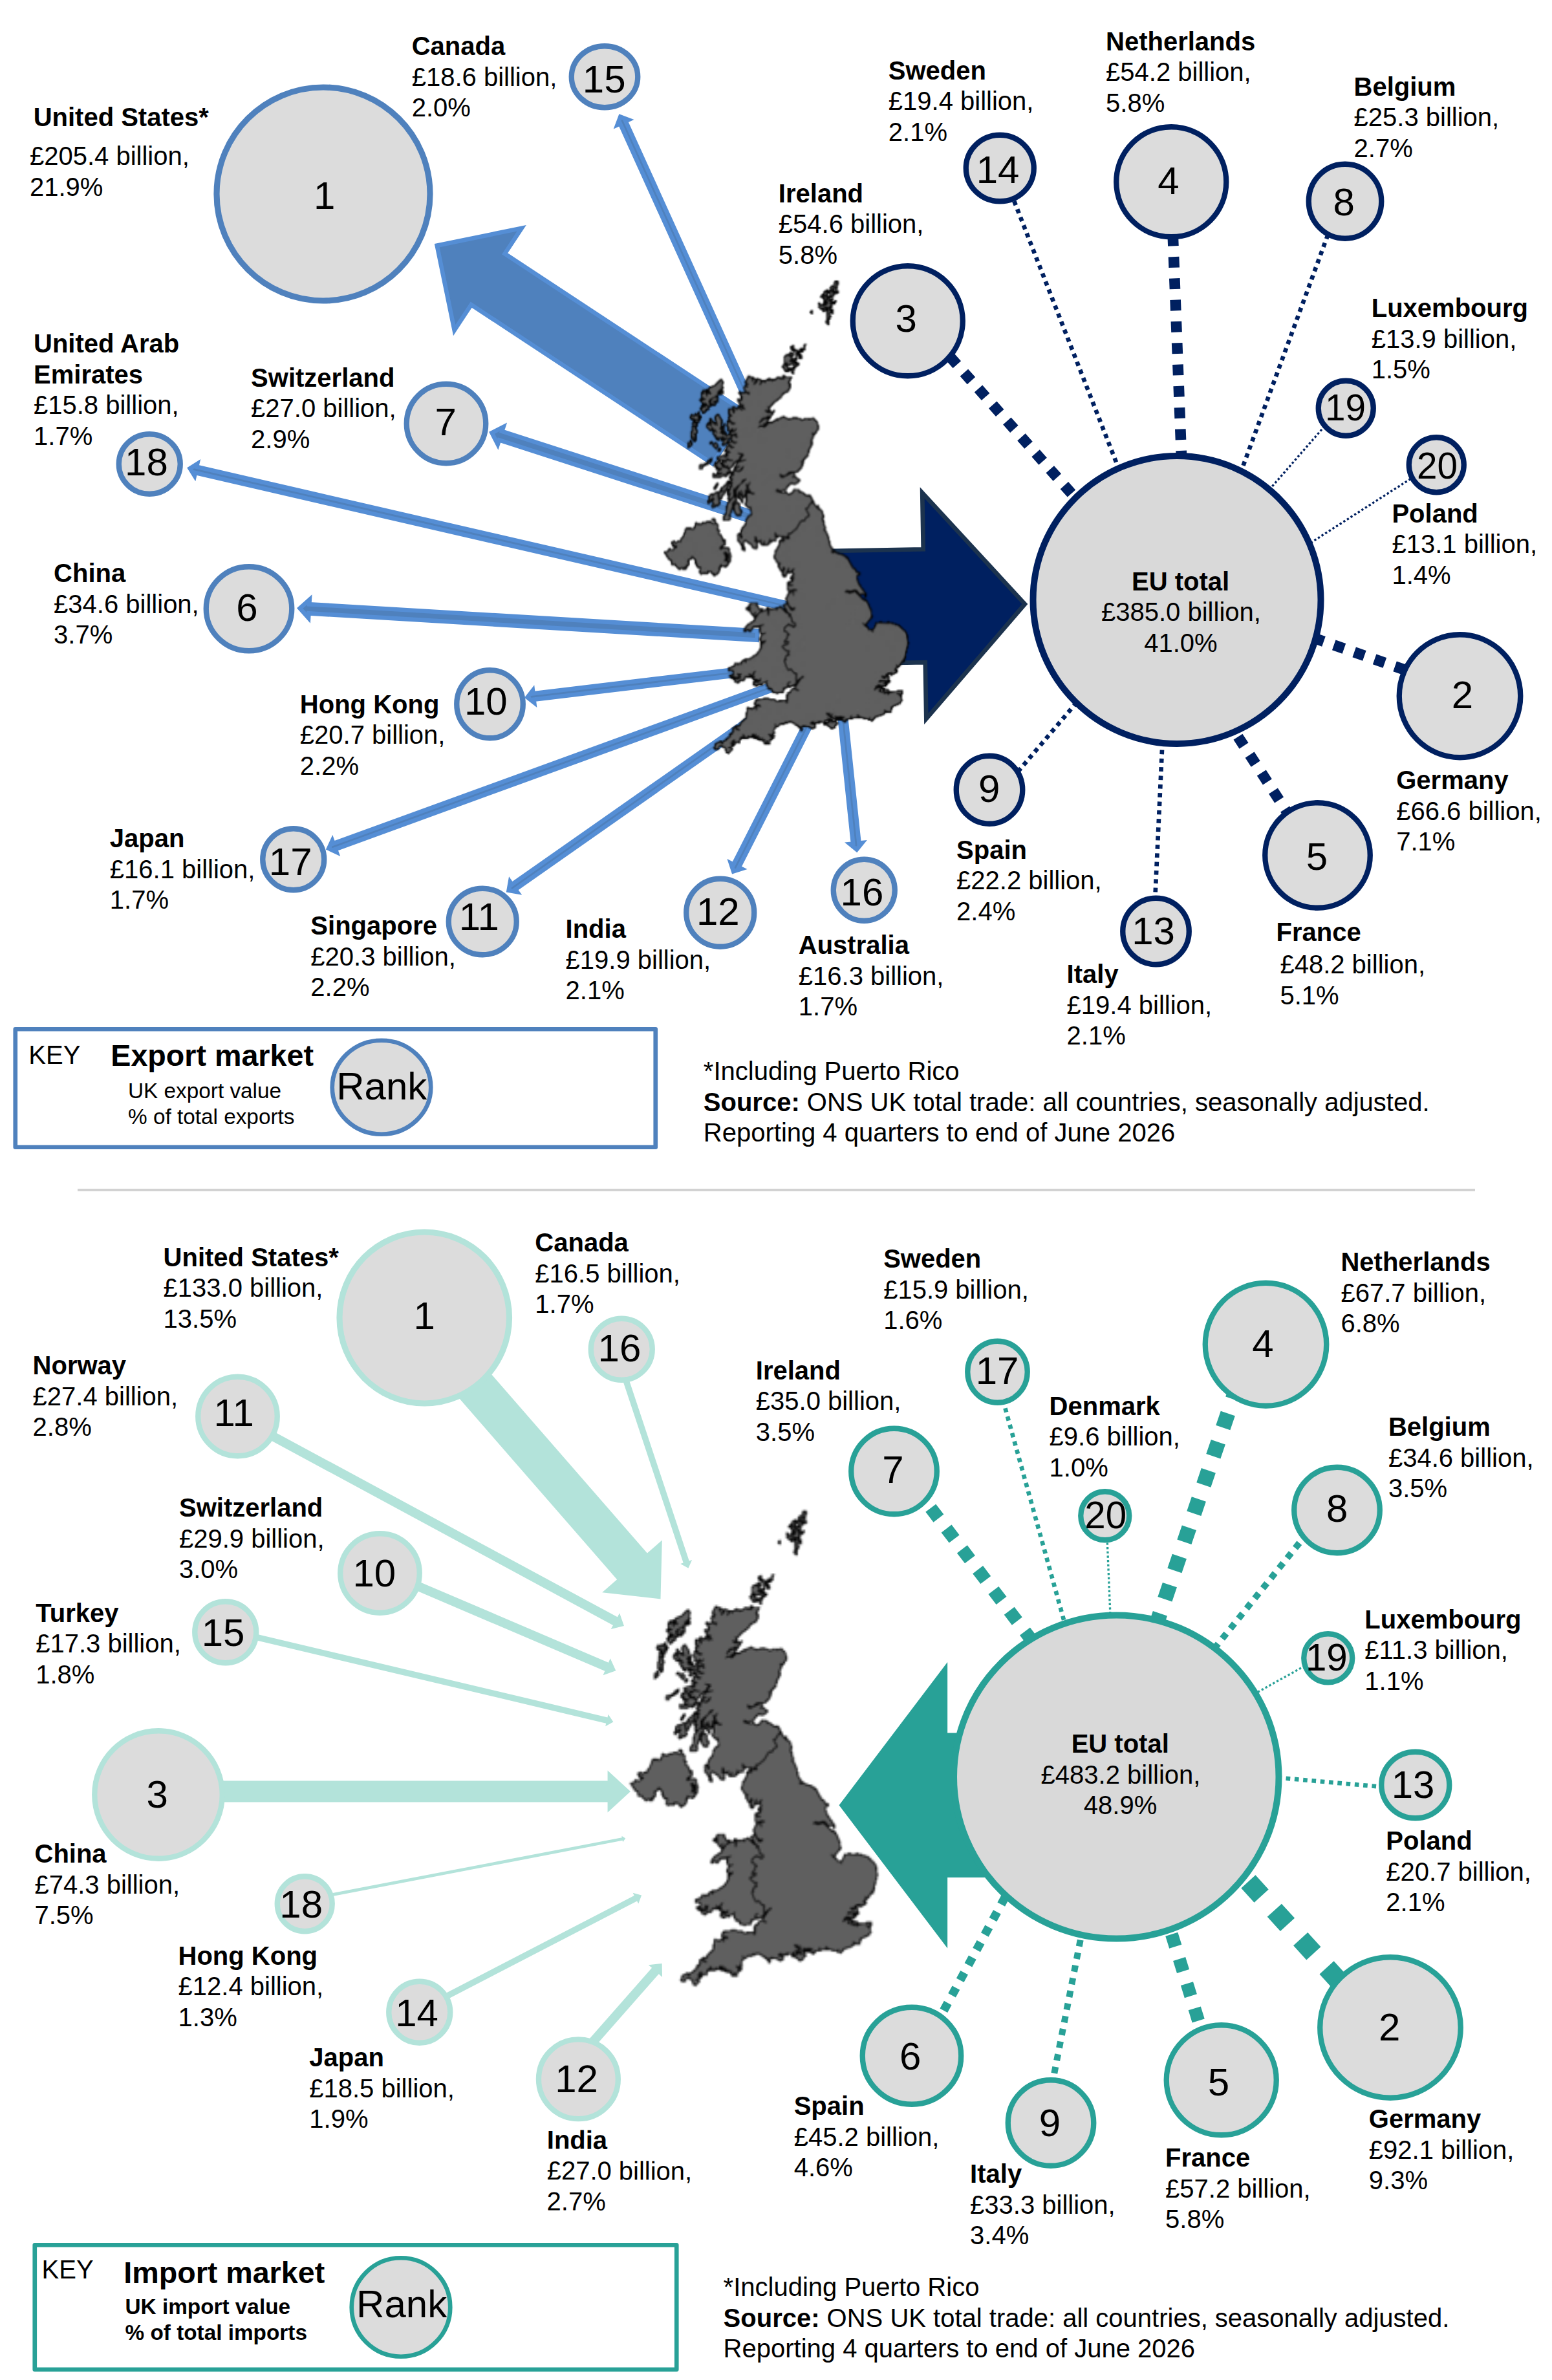
The United States is the UK’s biggest single trading partner. In the 12 months to June 2026 the UK exported £205.4 billion of goods and services to the US and imported £133.0 billion from it. Germany, the Netherlands, China and France come next. Taken together, the EU is still larger than any one country, with 41% of UK exports and 49% of UK imports.
Who is the UK’s biggest trading partner?
The US is the UK’s largest trading partner, with £338.5 billion of exports and imports combined in the year to June 2026. That is more than twice the UK’s trade with Germany, the second largest partner at £158.7 billion.
The figures come from the Department for Business, Innovation, Science and Trade (BIST) publication UK trade in numbers, updated on 19 November 2026, which uses the Office for National Statistics (ONS) series UK total trade, all countries. They cover goods and services together, in current prices, and include non-monetary gold and other precious metals. The US figure includes Puerto Rico.
The infographic above is BIST’s pair of charts for the same period, with the top 20 export markets at the top and the top 20 import markets below. It shows at a glance how much of the UK’s trade goes to the US on one side and to the EU on the other.
The UK’s top trading partners by total trade
Adding exports and imports together, the UK’s five biggest trading partners are the US, Germany, the Netherlands, China and France. These totals are our own sums of BIST’s top 30 export markets and top 30 import markets tables, and the share is of all UK trade (£1,926.4 billion) in the same 12 months.
| Rank | Partner | Total trade (£bn) | UK exports (£bn) | UK imports (£bn) | Share of UK trade |
|---|---|---|---|---|---|
| 1 | United States | 338.5 | 205.4 | 133.0 | 17.6% |
| 2 | Germany | 158.7 | 66.6 | 92.1 | 8.2% |
| 3 | Netherlands | 121.8 | 54.2 | 67.7 | 6.3% |
| 4 | China | 108.9 | 34.6 | 74.3 | 5.7% |
| 5 | France | 105.4 | 48.2 | 57.2 | 5.5% |
| 6 | Ireland | 89.7 | 54.6 | 35.0 | 4.7% |
| 7 | Spain | 67.4 | 22.2 | 45.2 | 3.5% |
| 8 | Belgium | 59.9 | 25.3 | 34.6 | 3.1% |
| 9 | Switzerland | 56.9 | 27.0 | 29.9 | 3.0% |
| 10 | Italy | 52.7 | 19.4 | 33.3 | 2.7% |
| 11 | India | 46.9 | 19.9 | 27.0 | 2.4% |
| 12 | Norway | 36.4 | 9.0 | 27.4 | 1.9% |
Seven of the top 12 are EU members. Outside Europe, only the US, China and India make the top 12, and Canada, Japan and Sweden sit just behind Norway at about £35 billion each.
The UK’s top export markets
The US takes 21.9% of all UK exports, by far the largest share. Germany is second with 7.1%, then Ireland and the Netherlands with 5.8% each and France with 5.1%, according to BIST’s top export markets table for the 12 months to June 2026.
- United States, £205.4 billion (up 1.3% on the year before)
- Germany, £66.6 billion (up 7.5%)
- Ireland, £54.6 billion (up 4.3%)
- Netherlands, £54.2 billion (up 7.0%)
- France, £48.2 billion (up 5.4%)
- China, £34.6 billion (up 12.0%)
- Switzerland, £27.0 billion (up 12.9%)
- Belgium, £25.3 billion (down 1.7%)
- Spain, £22.2 billion (up 5.8%)
- Hong Kong, £20.7 billion (up 26.5%)
Singapore (£20.3 billion), India (£19.9 billion), Italy and Sweden (£19.4 billion each) and Canada (£18.6 billion) complete the top 15. The fastest growth among the top 20 markets was to Hong Kong (up 26.5%) and Singapore (up 24.3%). Exports to Saudi Arabia fell the most, down 23.4% to £9.3 billion.
UK exports to the US were £137.1 billion in 2018, so they are about half as large again seven years on, BIST’s table shows. Most of that growth came before 2025.
Where the UK’s imports come from
The US is also the UK’s largest source of imports, at £133.0 billion or 13.5% of the total. Germany is close behind with £92.1 billion (9.3%), and China is third with £74.3 billion (7.5%), followed by the Netherlands, France and Spain, according to BIST’s top import markets table.
- United States, £133.0 billion
- Germany, £92.1 billion
- China, £74.3 billion
- Netherlands, £67.7 billion
- France, £57.2 billion
- Spain, £45.2 billion
- Ireland, £35.0 billion
- Belgium, £34.6 billion
- Italy, £33.3 billion
- Switzerland, £29.9 billion
Norway is the UK’s 11th largest source of imports (£27.4 billion) but only its 24th largest export market (£9.0 billion), which gives the UK one of its biggest deficits with a single country. Imports rose fastest from Luxembourg (up 44.5%), Canada (up 40.0%) and Switzerland (up 37.5%).
BIST’s figures include non-monetary gold and other precious metals. ONS leaves these out of its headline trade figures because movements in them “can be large and highly volatile, distorting underlying trends”, as it explains in its UK trade September 2026 bulletin. So a big change for one partner in one year is worth checking before you read too much into it.
How much UK trade is with the EU?
The EU accounts for 41.0% of UK exports and 48.9% of UK imports, so about 45% of all UK trade. In the 12 months to June 2026 the UK sold £385.0 billion of goods and services to the EU and bought £483.2 billion from it, BIST reports.
That leaves the UK with a deficit of about £98.2 billion with the EU and a surplus of about £48.3 billion with the rest of the world, by our calculation from the same EU and non-EU table. Exports to the EU grew 5.9% on the year before and exports to the rest of the world grew 4.1%.
The EU’s share has drifted down over time. Using the same table, the EU took 42.8% of UK exports in 2016 and 40.7% in 2025, and supplied 52.3% of UK imports in 2016 and 49.1% in 2025. BIST and ONS advise caution with comparisons across this period, because the way goods trade with the EU is recorded changed after the UK left the EU, which ONS sets out in its article on the structural break from 2021.
UK trade with the US
The UK sells far more to the US than it buys, with a surplus of about £72.4 billion in the year to June 2026 (£205.4 billion of exports against £133.0 billion of imports).
US tariffs have hit goods exports. ONS’s article on UK trade with the United States after the tariffs found that goods exports to the US, excluding precious metals, fell by £1.5 billion (24.7%) in April 2025 when the tariffs started, and stayed below pre-tariff levels through to February 2026. Car exports to the US fell too. Goods imports from the US were higher than goods exports to it for three months in a row from December 2025.
In May 2026 ONS still described the US as the UK’s largest goods export market and its third largest source of goods imports. The same article explains that the UK and US Economic Prosperity Deal, in effect from 30 June 2025, cut the 25% US tariff on UK cars to 10% for a set quota of cars each period.
What does the UK export?
Services make up most of what the UK sells abroad. In the 12 months to September 2026 the UK exported £545.5 billion of services and £411.4 billion of goods, £956.8 billion in total, according to UK trade in numbers.
The UK’s biggest goods exports are mechanical power generators at £47.5 billion, medicines and pharmaceutical products at £43.8 billion and cars at £27.2 billion. Crude oil (£21.4 billion), aircraft (£14.8 billion), refined oil (£13.8 billion), scientific instruments (£12.1 billion) and beverages and tobacco (£11.7 billion) follow.
| Top UK services exports, 4 quarters to September 2026 | Value (£bn) |
|---|---|
| Other business services (legal, accounting, consulting, advertising, engineering, research and development) | 181.5 |
| Financial services | 103.9 |
| Travel services | 69.5 |
| Telecoms, computer and information services | 56.6 |
| Transport services | 38.9 |
Car exports were 11.8% lower than a year earlier, while crude oil exports rose 26.9% and aircraft exports rose 18.0%, BIST’s top 30 goods exports table shows.
Exporting is still a minority activity for firms. ONS’s Annual Business Survey found 295,300 businesses in Great Britain exported in 2024, 12.1% of registered businesses in the non-financial business economy, as quoted in UK trade in numbers.
What does the UK import?
Most UK imports are goods. The UK bought £664.8 billion of goods and £343.8 billion of services from abroad in the 12 months to September 2026, £1,008.6 billion in total, BIST reports.
Cars are the single largest goods import at £49.2 billion, followed by mechanical power generators (£33.8 billion), refined oil (£31.0 billion), medicines and pharmaceutical products (£26.6 billion) and gold (£25.8 billion). The largest services imports are other business services (£121.5 billion) and travel services (£85.2 billion).
Does the UK have a trade deficit?
Yes. The UK imports more than it exports, with a gap of about £51.8 billion in the 12 months to September 2026, by our calculation from BIST’s totals (£956.8 billion of exports against £1,008.6 billion of imports, including precious metals).
The UK runs a large deficit in goods and a large surplus in services. In the third quarter of 2026 alone, the goods deficit was £61.5 billion and the services surplus was £51.1 billion, leaving a total deficit of £10.4 billion, ONS reported in its September 2026 trade bulletin (these ONS figures exclude precious metals). The total deficit widened by £6.2 billion on the quarter before because imports grew faster than exports.
By partner, the largest deficits in the year to June 2026 were with China (about £39.8 billion), Germany (£25.5 billion), Spain (£23.0 billion) and Norway (£18.4 billion), among the partners in both of BIST’s top 30 tables. The largest surpluses were with the US (£72.4 billion), Ireland (£19.6 billion) and Singapore (£11.2 billion).
How the UK ranks among the world’s exporters
The UK was the world’s fourth largest exporter of goods and services in 2025, behind China, the US and Germany, and also the fourth largest importer, according to UNCTAD figures compiled in UK trade in numbers. Its exports were worth US$1,225.1 billion in 2025, just ahead of France (US$1,131.5 billion) and the Netherlands (US$1,128.2 billion), BIST’s global export rankings table shows.
Services do much of the work in that ranking. They made up about 57% of UK exports in the 12 months to September 2026 (£545.5 billion of £956.8 billion), by our calculation from BIST’s figures.
Questions about UK trading partners
What are the UK’s top 5 trading partners?
By total trade in the 12 months to June 2026, the UK’s top five trading partners were the United States (£338.5 billion), Germany (£158.7 billion), the Netherlands (£121.8 billion), China (£108.9 billion) and France (£105.4 billion). These are our sums of BIST’s export and import tables.
Is the EU or the US the UK’s biggest trading partner?
The US is the biggest single country, but the EU as a bloc is bigger. UK trade with the EU came to about £868.2 billion in the year to June 2026, against £338.5 billion with the US.
What is the UK’s biggest export?
Services are the UK’s biggest export overall, led by other business services such as legal, accounting and consulting work (£181.5 billion) and financial services (£103.9 billion). The biggest goods exports are mechanical power generators (£47.5 billion), medicines (£43.8 billion) and cars (£27.2 billion).
Who does the UK import the most from?
The UK imports the most from the United States (£133.0 billion in the year to June 2026), then Germany (£92.1 billion) and China (£74.3 billion). As a bloc, the EU supplies 48.9% of UK imports.
Has UK trade with the EU fallen since Brexit?
The EU’s share of UK trade has slipped, from 42.8% of exports and 52.3% of imports in 2016 to 40.7% and 49.1% in 2025, but the value of trade with the EU has grown in cash terms. ONS warns that changes to how goods trade with the EU has been recorded since 2021 make direct comparisons less reliable.
How often are UK trade figures updated?
ONS publishes UK trade figures every month, and BIST updates UK trade in numbers to match. The next update is due on 18 December 2026, using the ONS release for October 2026. The partner country figures used in the infographic are quarterly, and the next update for those is due in 2027.
Sources
- Department for Business, Innovation, Science and Trade, UK trade in numbers (web version), updated 19 November 2026 (the infographic)
- Department for Business, Innovation, Science and Trade, Top 30 UK export markets and Top 30 UK import markets, 12 months to June 2026
- Department for Business, Innovation, Science and Trade, UK exports and imports by EU and non-EU
- Department for Business, Innovation, Science and Trade, Top 30 UK goods exports and global export rankings
- Office for National Statistics, UK trade, September 2026
- Office for National Statistics, UK total trade, all countries, seasonally adjusted
- Office for National Statistics, UK trade with the United States following the introduction of US tariffs
- Office for National Statistics, Impact of trade in goods data collection changes on UK trade statistics
Contains public sector information published by the Department for Business, Innovation, Science and Trade and the Office for National Statistics and licensed under the Open Government Licence v3.0. Its use here does not imply any endorsement by either organisation.