Key points from the chart
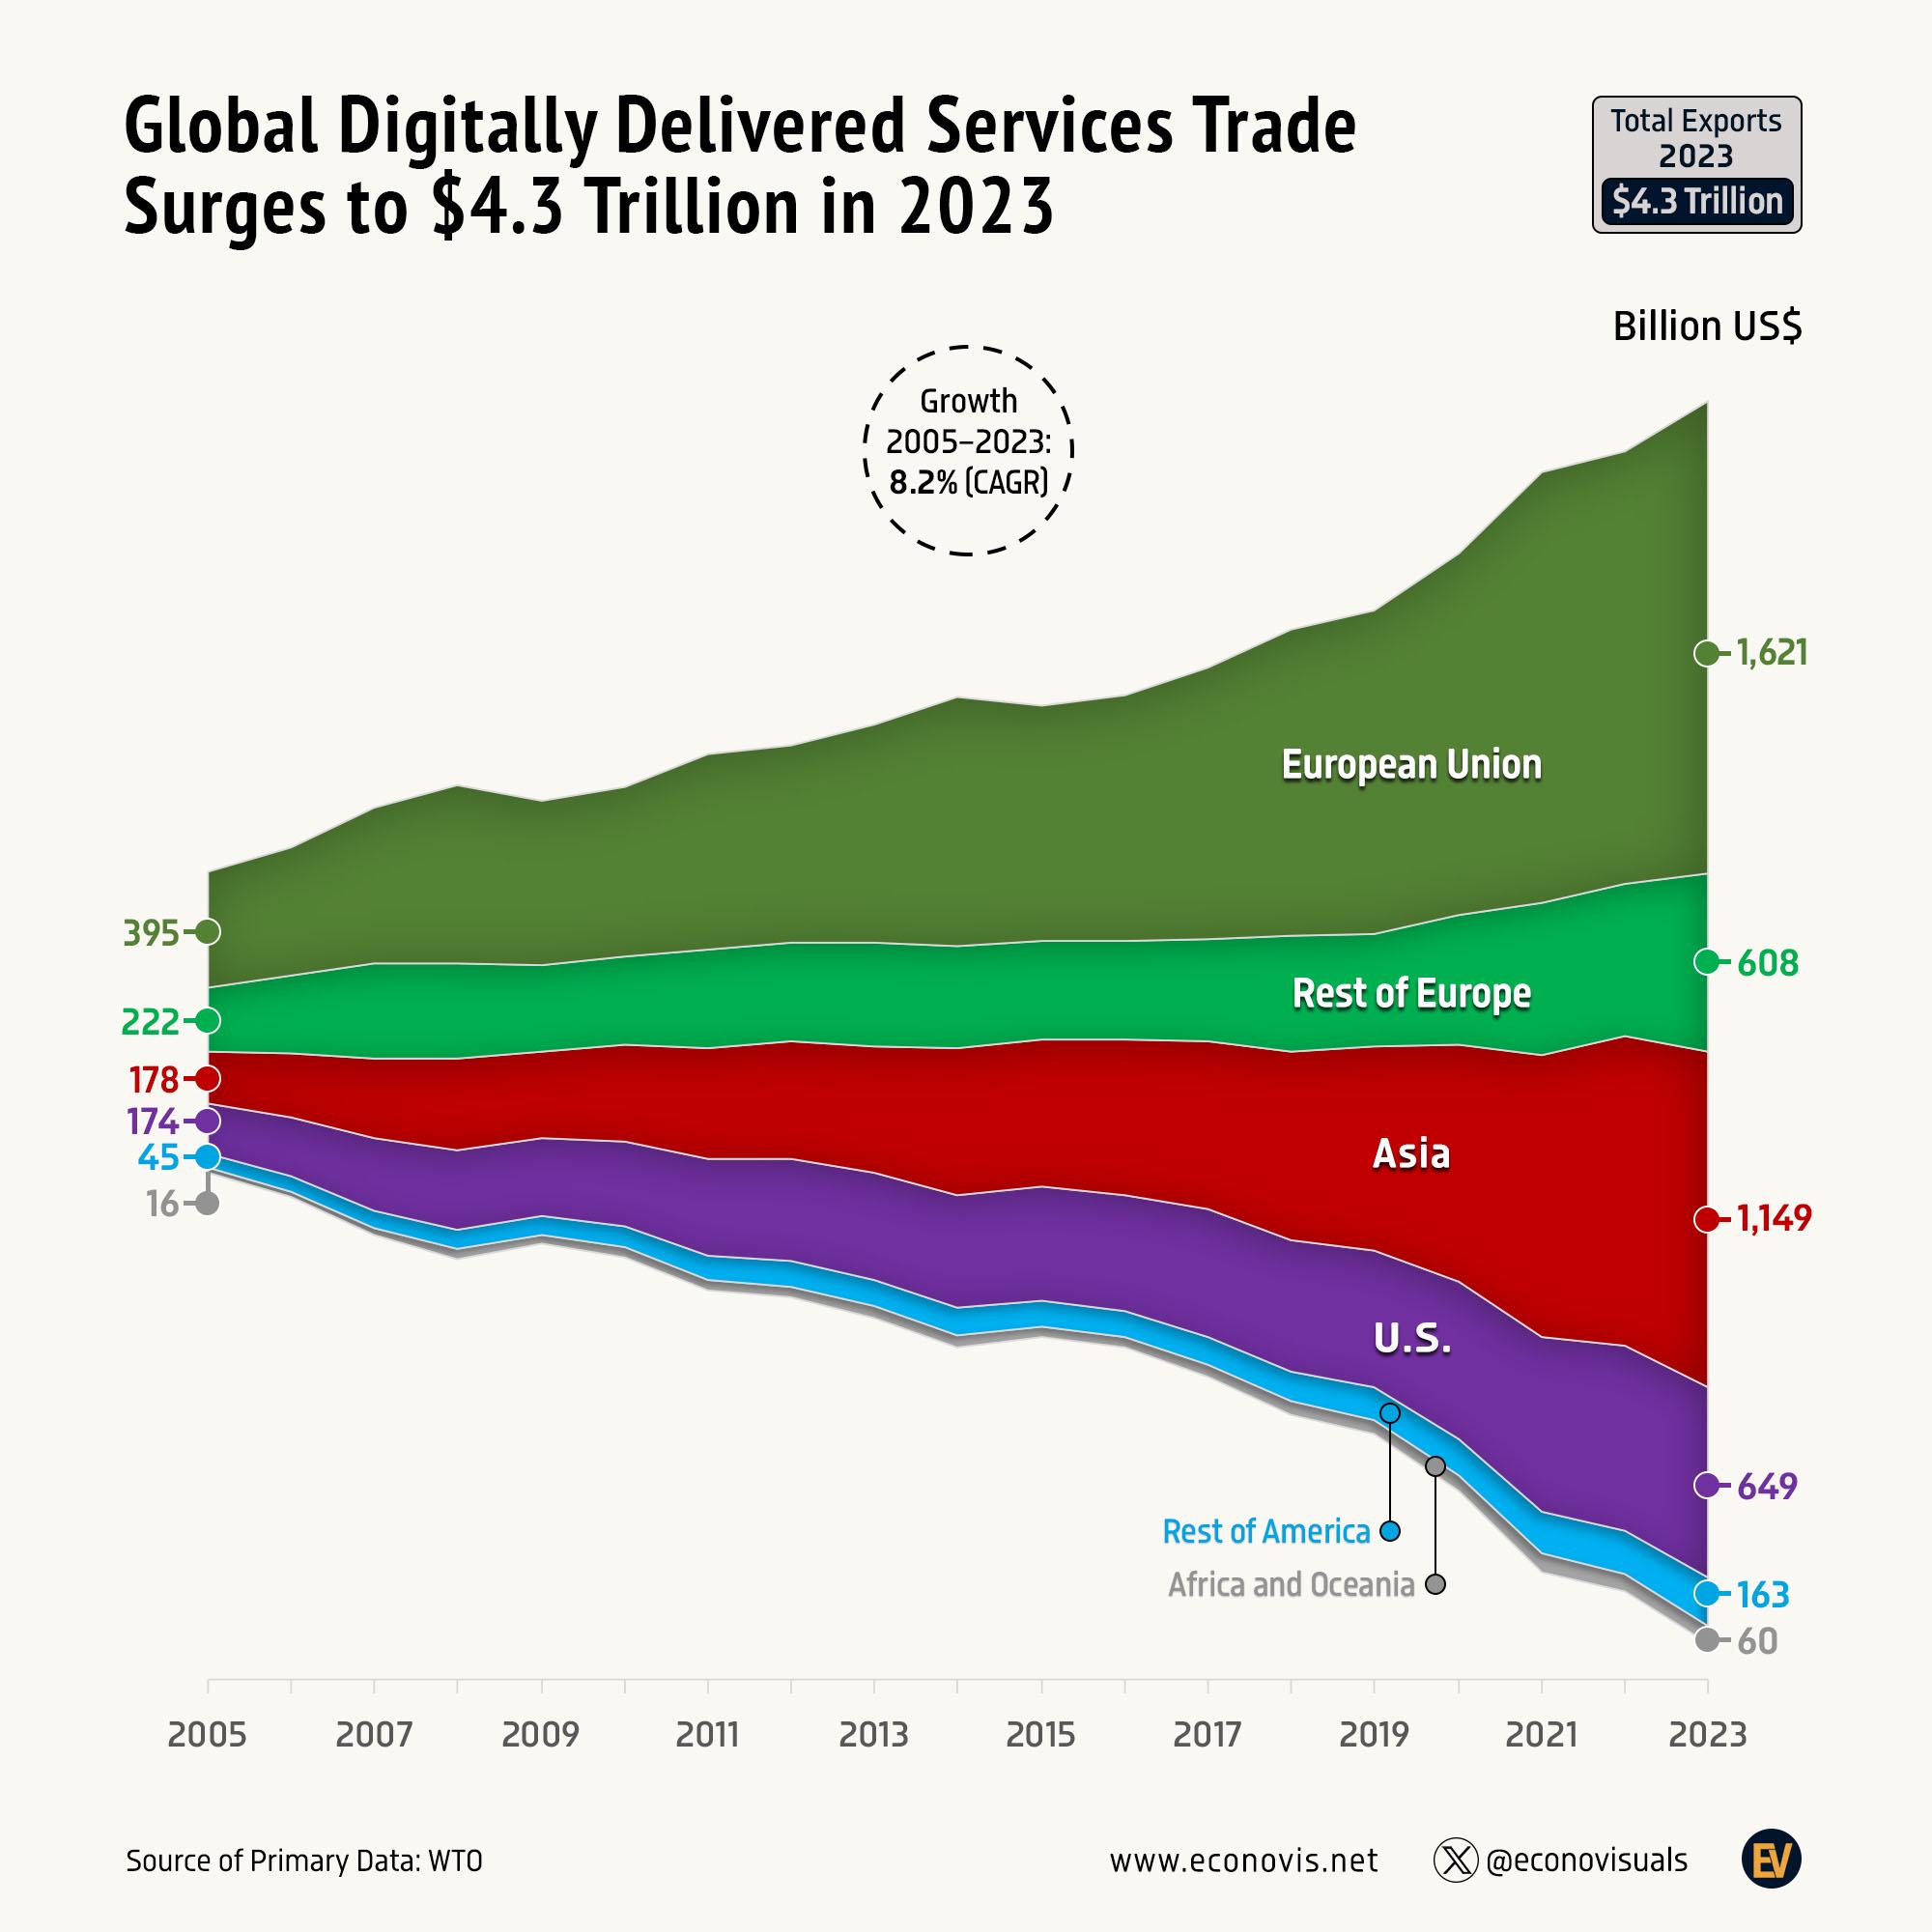
- World exports of digitally delivered services grew from about $1.0 trillion in 2005 to $4.3 trillion in 2023, according to Econovis using WTO data [1].
- That is a compound annual growth rate (CAGR) of 8.2% over 18 years, the figure printed in the chart’s circle [1].
- The European Union is the largest exporter at both ends of the chart, with $1,621 billion in 2023.
- Asia grew fastest, about 6.5 times, and moved from third place to second.
- Rest of Europe grew slowest, about 2.7 times, and fell from second place to fourth.
Digitally delivered services trade in text
Title: Global Digitally Delivered Services Trade Surges to $4.3 Trillion in 2023. A box at the top right reads Total Exports 2023, $4.3 Trillion. A dashed circle reads Growth 2005 to 2023, 8.2% (CAGR). Values are in billion US dollars. Footer: Source of Primary Data, WTO; www.econovis.net; @econovisuals on X.
The chart is a streamgraph: each coloured band is one region, its thickness is that region’s exports and the full height of the stack is the world total. There is no vertical axis, so the only exact values are the labels at 2005 and 2023, listed below. Growth multiples and shares are our arithmetic from those labels.
| Region | 2005 exports (US$ billion) | 2023 exports (US$ billion) | Growth 2005 to 2023 | Share of 2023 total |
|---|---|---|---|---|
| European Union | 395 | 1,621 | 4.1 times | 38% |
| Asia | 178 | 1,149 | 6.5 times | 27% |
| U.S. | 174 | 649 | 3.7 times | 15% |
| Rest of Europe | 222 | 608 | 2.7 times | 14% |
| Rest of America | 45 | 163 | 3.6 times | 4% |
| Africa and Oceania | 16 | 60 | 3.8 times | 1% |
| Total | 1,030 | 4,250 | 4.1 times | 100% |
The bands run, top to bottom, European Union (dark olive), Rest of Europe (bright green), Asia (red), U.S. (purple), Rest of America (light blue) and Africa and Oceania (grey). The stack dips slightly around 2009 and 2015 and widens quickly after 2020.
What counts as a digitally delivered service
The WTO defines digitally delivered services trade as services traded through computer networks, such as the internet, apps, emails, voice and video calls, and digital intermediation platforms [2]. Its coverage follows the definition in the joint IMF, OECD, UNCTAD and WTO Handbook on Measuring Digital Trade [2]. The measure is about the service crossing a border over a network, not about goods ordered online.
The WTO publishes these as estimates, not customs records. Its dataset covers over 200 economies and regions and eight sub-sectors, and it is revised as countries publish new services data [2]. The figures on a chart made from one release can therefore move slightly in later releases.
How the regions compare
In its write-up, Econovis gives the growth rate for each leading region: Asia 10.9% a year, the European Union 8.2% and the United States 7.6% [1]. It says the 8.2% outpaced goods exports and overall services exports, for which it gives figures of 4.6% and 6.2%, and that advanced economies made up more than 80% of the 2023 total [1].
The European Union’s share was steady, at about 38% in both 2005 and 2023. Asia’s share rose from about 17% to 27%. The United States roughly kept pace with the world, while Rest of Europe, which includes the United Kingdom and Switzerland, lost share. The chart counts the European Union as one exporter; part of its total is trade between EU members.
UN Trade and Development (UNCTAD) reports a slightly larger world figure for 2023, $4.5 trillion, using its own measure of digitally deliverable services, and says these services account for 56% of world services exports [3]. UNCTAD also reports that developing economies passed $1 trillion of these exports for the first time in 2023, and that the share held by the least developed countries fell from 0.24% in 2015 to 0.19% in 2023 [3].
Notes on this infographic
- Rounding. The six 2023 labels add up to $4,250 billion, which the title rounds to $4.3 trillion. The 2005 labels add up to $1,030 billion. The CAGR from those two totals is 8.2%, matching the chart.
- Different measures. WTO estimates of digitally delivered trade and UNCTAD estimates of digitally deliverable trade are not the same series, so the $4.3 trillion here and UNCTAD’s $4.5 trillion for 2023 should not be compared directly [2] [3].
- Older article. An earlier version of this page said the sector grew 10% a year over the past decade. We could not find that figure in the sources above, so it has been removed.
Questions about digitally delivered services
What is the average annual growth rate of global digital services trade?
Econovis, using WTO data, puts the compound annual growth rate of world digitally delivered services exports at 8.2% from 2005 to 2023 [1]. Growth was faster in Asia, at 10.9% a year, than in the European Union (8.2%) or the United States (7.6%) [1].
What are digitally delivered services?
They are services sold across borders through computer networks, for example over the internet, apps, email, video calls or digital platforms, as defined in the joint IMF, OECD, UNCTAD and WTO handbook on measuring digital trade [2].
Which region exports the most digital services?
The European Union, with $1,621 billion of digitally delivered services exports in 2023, about 38% of the world total. Asia was second with $1,149 billion, followed by the U.S. ($649 billion) and Rest of Europe ($608 billion). The European Union was also the largest exporter in 2005, with $395 billion, although part of its total is trade between EU members.
How much were global digital services exports worth in 2023?
World exports of digitally delivered services reached $4.3 trillion in 2023, up from about $1.0 trillion in 2005, according to Econovis using WTO data [1]. The six regional labels add up to $4,250 billion, which the title rounds to $4.3 trillion. UNCTAD reports $4.5 trillion for 2023 using its own measure of digitally deliverable services, so the two figures should not be compared directly [3].
Sources
- Econovis, Global Digitally Delivered Services Trade Surges to $4.3 Trillion in 2023, the creator’s post for this chart.
- World Trade Organization, Digitally delivered services trade dataset.
- UN Trade and Development, Developing economies surpass $1 trillion mark in digitally deliverable services exports.
Last reviewed 30 October 2026