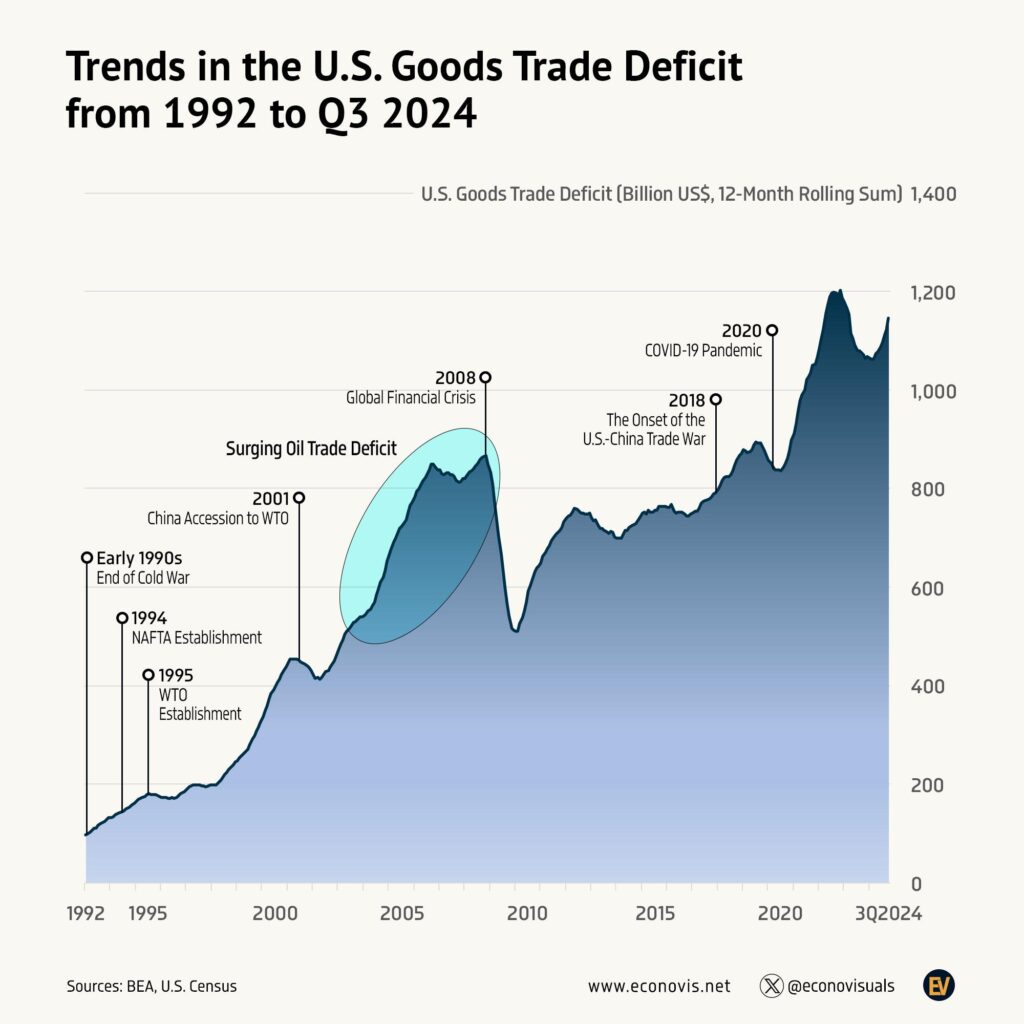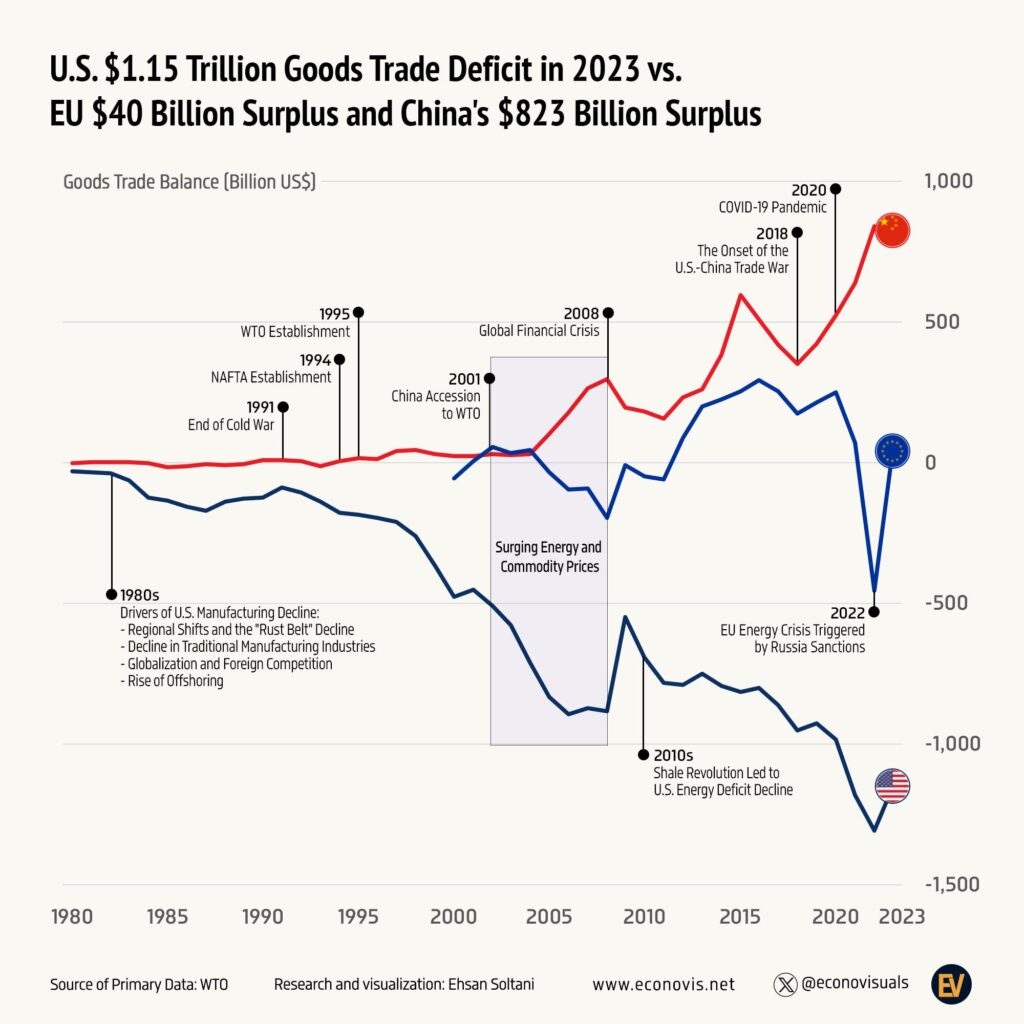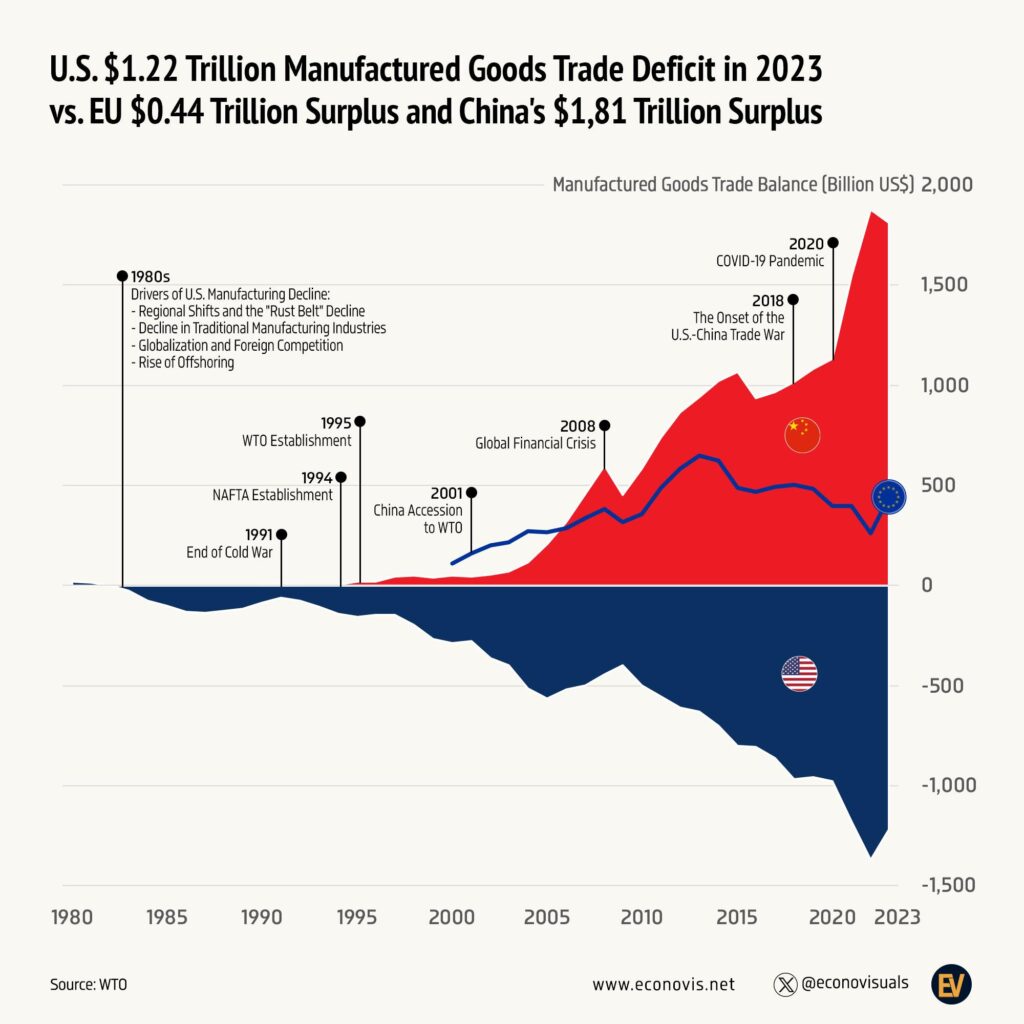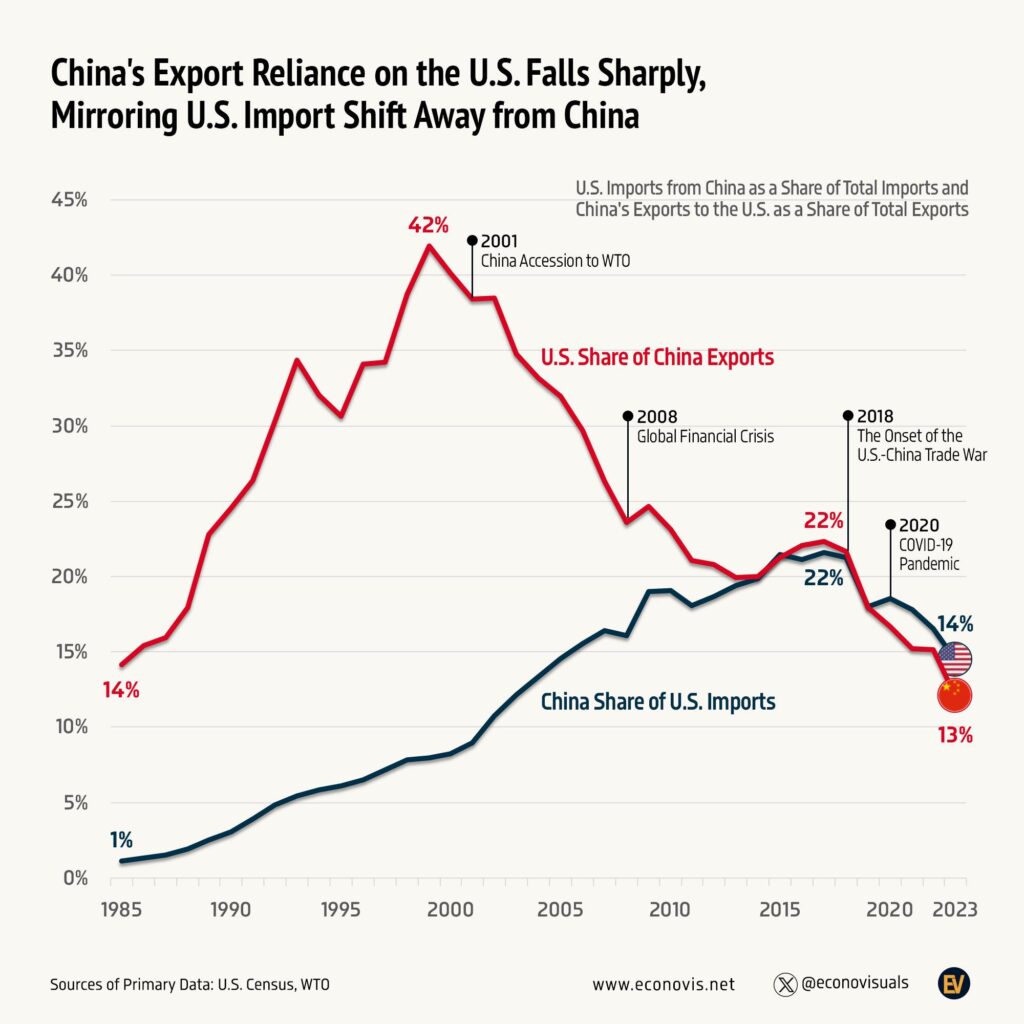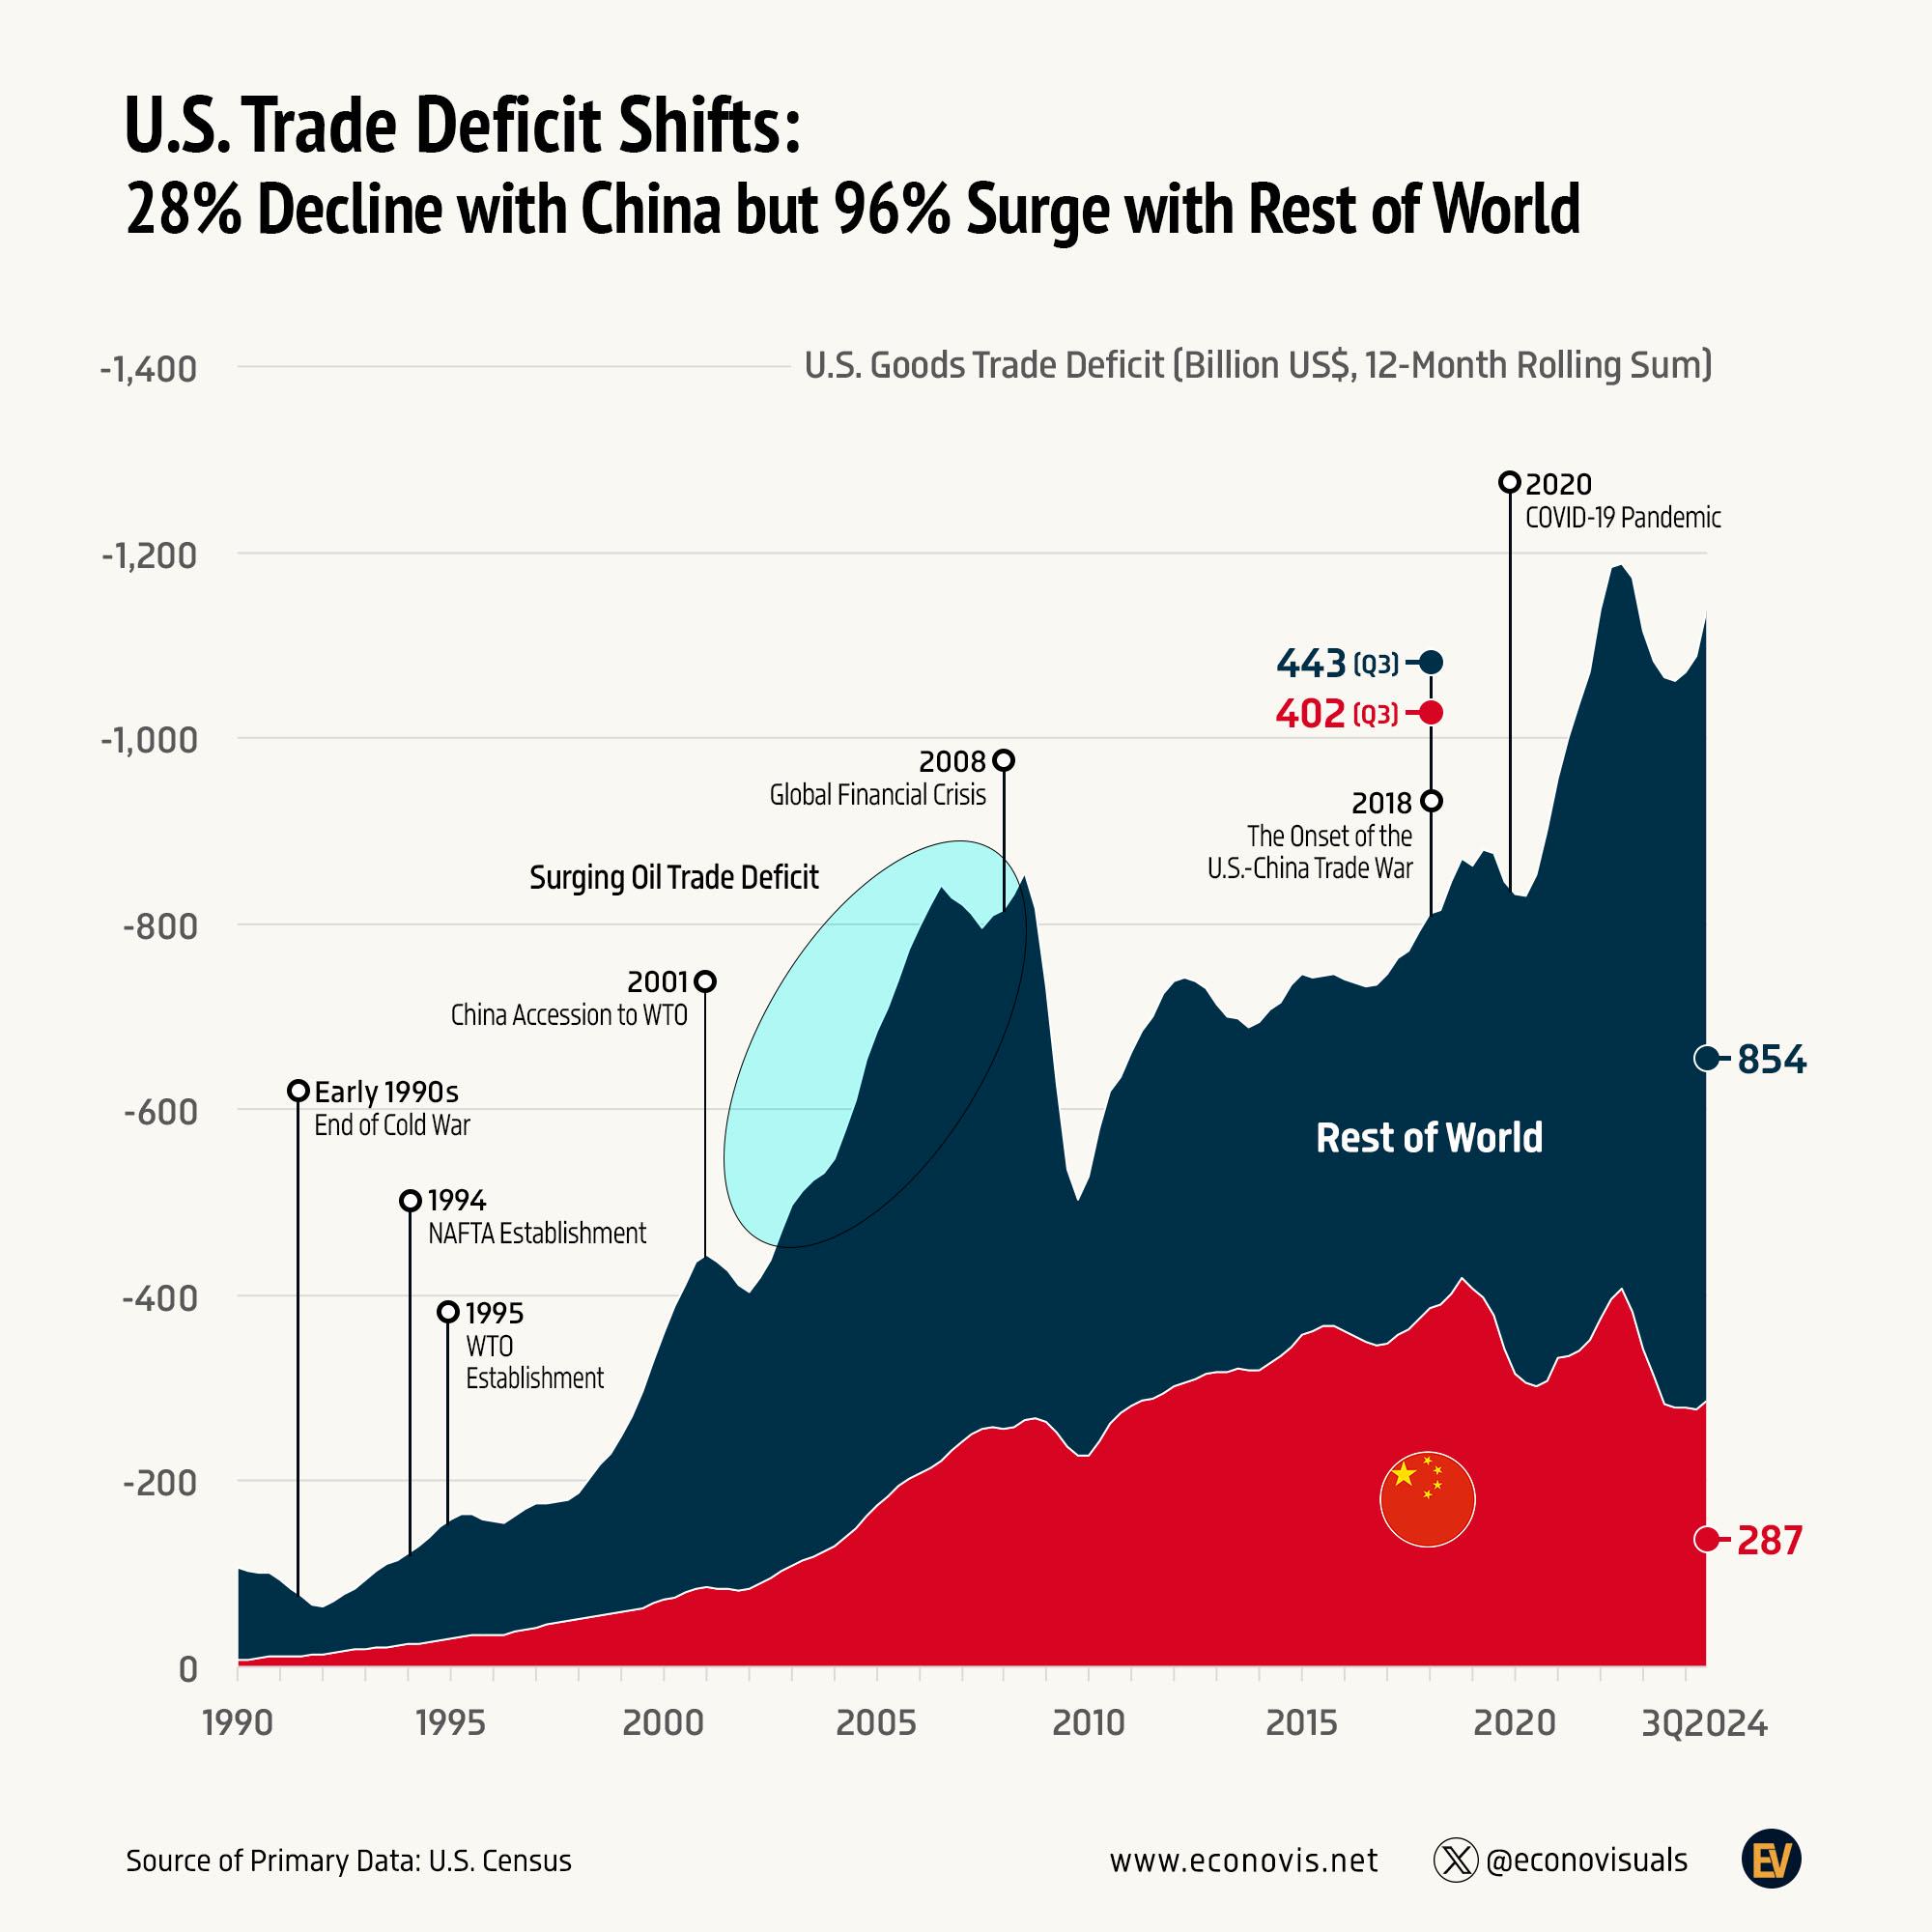
A graph of the US trade deficit shows two things. The overall goods deficit has kept growing, from about $870 billion in 2018 to a record $1.23 trillion in 2025, but the share coming from China has collapsed, from 48% to 16%, according to US Census Bureau figures. The gap has moved to Mexico, Vietnam, Taiwan and other countries, and in 2026 the US deficit with Vietnam passed its deficit with China.
The infographic by Econovis graphs the US goods trade deficit from 1990 to late 2024, split between China and the rest of the world, which is the clearest way to see that shift. This article gives the latest Census figures, explains what changed after the 2018 tariffs and what the shift does and does not mean.
The US trade deficit by year
The US has run a goods trade deficit every year since 1976, and it has grown in most years since the early 1990s [2]. These are the Census Bureau’s annual figures for the deficit in goods, with China and the rest of the world shown separately [2] [3].
| Year | Total goods deficit | With China | With the rest of the world | China’s share |
|---|---|---|---|---|
| 2017 | $792.4bn | $375.2bn | $417.2bn | 47% |
| 2018 | $870.4bn | $418.2bn | $452.2bn | 48% |
| 2024 | $1,200.9bn | $297.0bn | $903.9bn | 25% |
| 2025 | $1,234.6bn | $202.7bn | $1,031.9bn | 16% |
| January to September 2026 | $919.7bn | $131.5bn | $788.2bn | 14% |
Figures are goods only, on the Census basis, not seasonally adjusted. Over seven years the deficit with China roughly halved while the deficit with everyone else more than doubled [2] [3]. For the long run of the goods deficit since 1992 see our US trade deficit chart, and for goods and services together see the US trade deficit by year.
How the deficit moved from China to other countries
As the Econovis infographic shows, the turning point was the start of the US and China trade war in 2018. On 12 month rolling totals, the goods deficit with China fell from $402 billion in the third quarter of 2018 to $287 billion in the third quarter of 2024, while the deficit with the rest of the world rose from $443 billion to $854 billion [1]. The total therefore rose from about $845 billion to about $1,141 billion.
The graphic’s title rounds these changes to a 28% fall with China and a 96% rise with the rest of the world. Those percentages come from Econovis’s comparison of the first nine months of 2018 and 2024 ($301 billion to $217 billion for China, $334 billion to $655 billion for the rest) [1]. On the 12 month figures printed on the graph itself the changes are about 29% and 93%.
Econovis also measures the change against the size of the US economy. The deficit with China fell from 2.0% to 1.0% of GDP between the third quarters of 2018 and 2024, while the deficit with the rest of the world rose from 2.2% to 3.0% [4].
Which countries the US now has the biggest deficits with
Mexico, Vietnam and Taiwan have taken over much of China’s place. In the first nine months of 2026 the US goods deficit was $190.9 billion with Vietnam, $184.0 billion with Mexico and $171.1 billion with Taiwan, each larger than the $131.5 billion with China, according to the Census Bureau [3] [5].
| Country | Goods deficit 2018 | Goods deficit 2025 | January to September 2026 |
|---|---|---|---|
| China | $418.2bn | $202.7bn | $131.5bn |
| Mexico | $77.7bn | $197.0bn | $184.0bn |
| Vietnam | $39.5bn | $178.3bn | $190.9bn |
| Taiwan | $15.2bn | $146.6bn | $171.1bn |
| Ireland | $46.7bn | $114.4bn | $27.1bn |
| Thailand | $19.3bn | $71.7bn | $84.9bn |
| Germany | $68.0bn | $73.0bn | $50.0bn |
| Japan | $67.1bn | $64.4bn | $33.8bn |
| India | $21.1bn | $58.4bn | $37.6bn |
| South Korea | $17.9bn | $56.5bn | $67.3bn |
Source is the Census Bureau’s trade in goods by country tables [5]. The deficit with Taiwan was almost ten times larger in 2025 than in 2018, and the deficit with Vietnam four and a half times larger. Ireland’s figure more than doubled between 2018 and 2025 and then fell back sharply in 2026 [5]. For the EU and China compared, see our page on the US China trade deficit chart.
Why the deficit shifted rather than shrank
Tariffs on Chinese goods made it more expensive to import directly from China, but US demand for the goods did not go away. Companies moved assembly to Vietnam, Mexico and other countries, and some Chinese firms set up factories there, so the imports now arrive from a different country. Econovis says part of the change may be trade rerouted through other countries to get around the restrictions on US and China trade [4].
The overall deficit is driven by things tariffs on one country do not change much. The US spends more than it produces and saves less than it invests, so it imports more than it exports, and a strong dollar makes imports cheaper. The Econovis graphic marks the earlier jumps clearly. The deficit grew after China joined the World Trade Organization in 2001 and during the mid 2000s oil price rise, then fell sharply in the 2008 financial crisis as US spending dropped, and jumped again after the 2020 pandemic [1].
Goods deficit and the services surplus
The graph covers goods only. The US runs a surplus on services such as finance, software, travel and education, which offsets part of the goods deficit. In 2025 the goods deficit on a balance of payments basis was $1,240.9 billion and the services surplus $339.5 billion, giving a total trade deficit of $901.5 billion [2]. That total was slightly smaller than the $903.5 billion in 2024 because the services surplus grew [2].
Questions about the US trade deficit
What is the current US trade deficit?
The US goods deficit was $919.7 billion in the first nine months of 2026 and $1,234.6 billion for the whole of 2025, according to the Census Bureau [3]. Including services, the total trade deficit was $901.5 billion in 2025 [2].
Has the US trade deficit with China gone down?
Yes. It fell from $418.2 billion in 2018 to $202.7 billion in 2025, and was $131.5 billion in the first nine months of 2026 [5]. China’s share of the US goods deficit fell from 48% to 16% between 2018 and 2025.
Which country does the US have the biggest trade deficit with?
In 2025 it was still China, at $202.7 billion, just ahead of Mexico at $197.0 billion. In the first nine months of 2026 Vietnam was the largest at $190.9 billion, followed by Mexico and Taiwan [5].
When was the last time the US had a trade surplus?
1975, when the US had a surplus of $12.4 billion on goods and services. It has run a trade deficit every year since 1976, according to the Census Bureau’s historical series [2].
What is a trade deficit?
It is the amount by which the value of a country’s imports is greater than the value of its exports over a period. A deficit in goods means the US buys more physical products from other countries than it sells to them.
Sources
- Econovis, U.S. Trade Deficit Shifts, 28% Decline with China but 96% Surge with Rest of World, 7 January 2025. The creator’s post for this graphic.
- US Census Bureau, US trade in goods and services, balance of payments basis, 1960 to present.
- US Census Bureau, Trade in goods with World, monthly and annual totals, accessed November 2026.
- Econovis, U.S. Trade Deficit, Shift from China to the Rest of the World, 2 February 2025.
- US Census Bureau, trade in goods by country, China, Mexico, Vietnam, Taiwan and the full country list.