

Entertainment
Rings of Power in Middle Earth, the 20 Great Rings Explained
The Rings of Power are the twenty Great Rings of Tolkien's Middle-earth: three for the Elves, seven for the Dwarves, nine for Men and the One Ring for Sauron.
471 reviewed infographics. Search them, or narrow the list by topic and sort it the way you want.
The Rings of Power are the twenty Great Rings of Tolkien's Middle-earth: three for the Elves, seven for the Dwarves, nine for Men and the One Ring for Sauron.
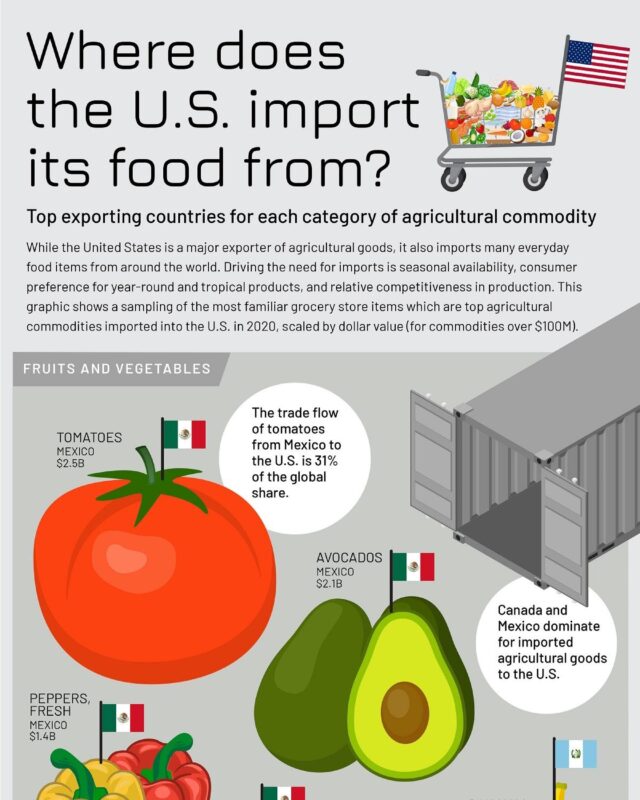
US agricultural imports reached $212 billion in 2025.
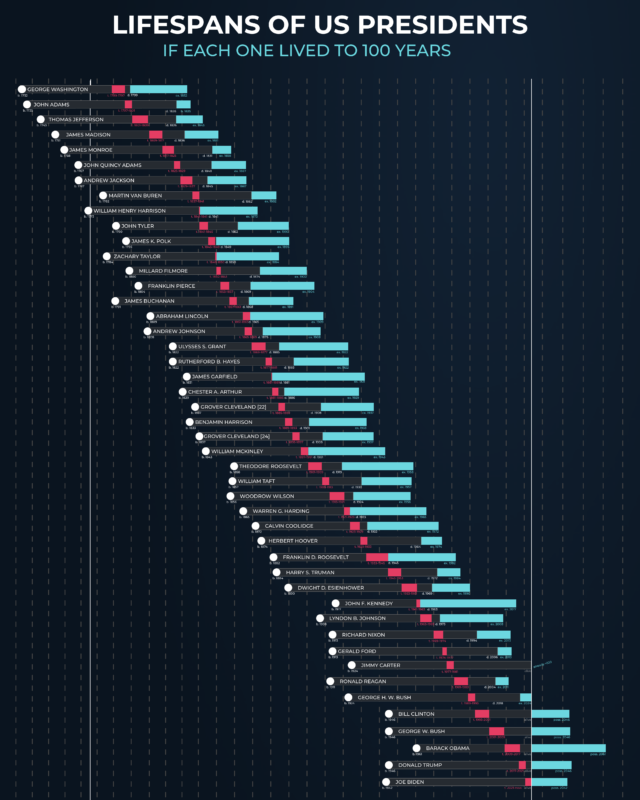
Of the 40 presidents who have died, John F.

At 2024 US prices, brown rice cost about 5 cents per 100 calories and broccoli about 77 cents, because low calorie foods are mostly water.

Massachusetts and Minnesota are close behind New Hampshire, Louisiana and Mississippi are near the bottom, and every state sits inside the average IQ range…

Machinery and electronics make up almost half of China's $3.59 trillion of exports, while clothing, shoes and toys have shrunk from about a third in 2000 to…

World output is 3.7 times its 1967 level, but it has been flat since a 2021 peak, with China's output falling, India growing fast and the older producers in…

A $50 NES game in 1985 is about $157 in today's money and a $60 PlayStation 3 game in 2006 about $100, while a standard new game costs $70 in 2026, rising…
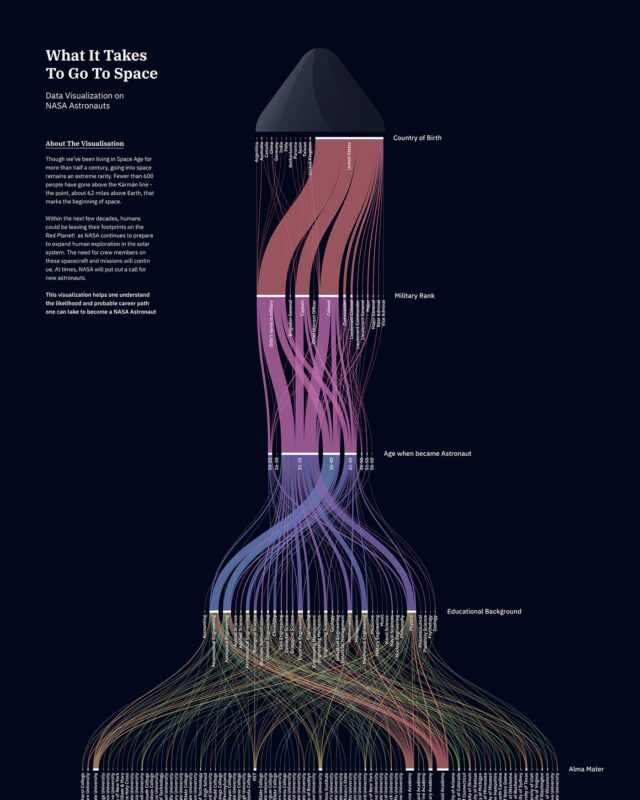
This NASA data visualization traces that path, and NASA's records of the 357 astronauts selected from 1959 to 2009 put numbers on it: 94% were born in the…

The IMF projects world growth of 3.1% in 2026, with India the fastest growing large economy at 7.0%, China 4.5%, the US 2.3% and the UK 1.3%.

The world rate was 43.6% in 2024.
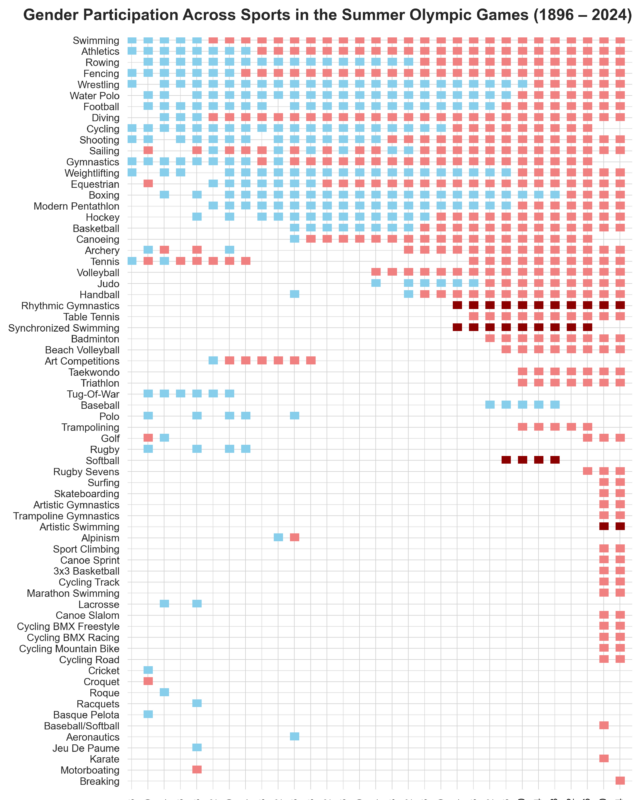
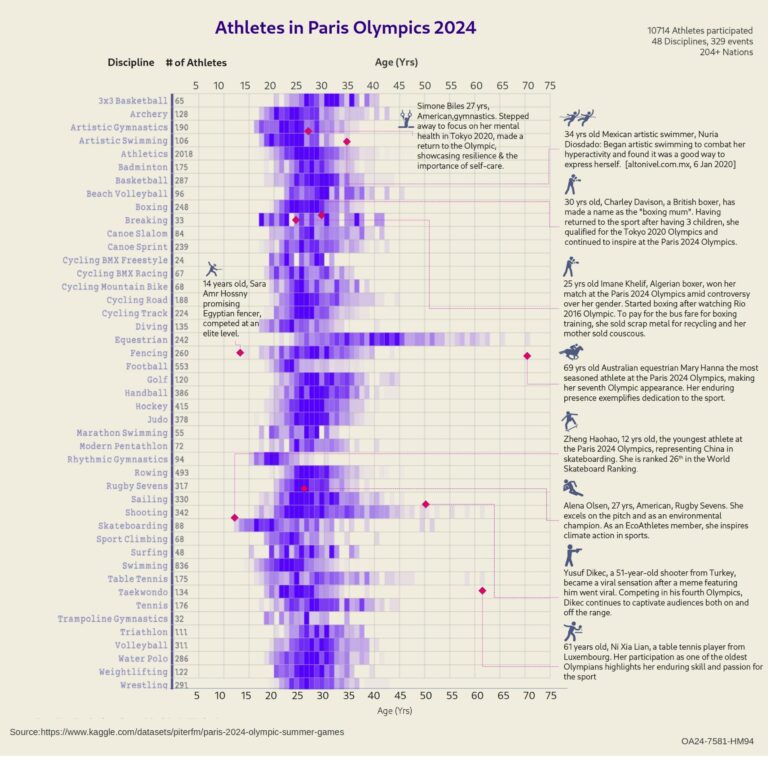
The first modern Olympics in 1896 had no women; Paris 2024 had 5,300 women among 10,813 athletes, and LA28 will be the first Games with more quota places…
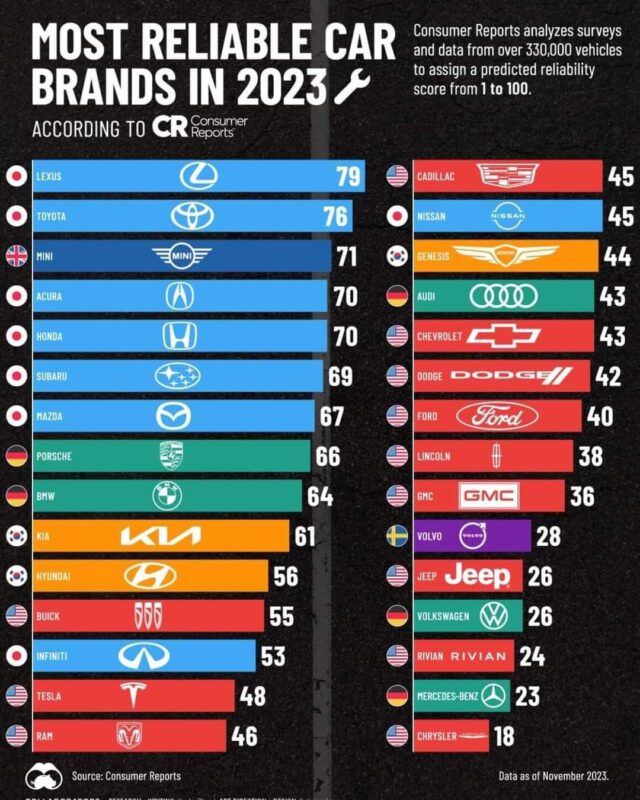
In its November 2023 ranking Lexus was top on 79 out of 100, ahead of Toyota on 76 and Mini on 71, while Chrysler was last on 18.
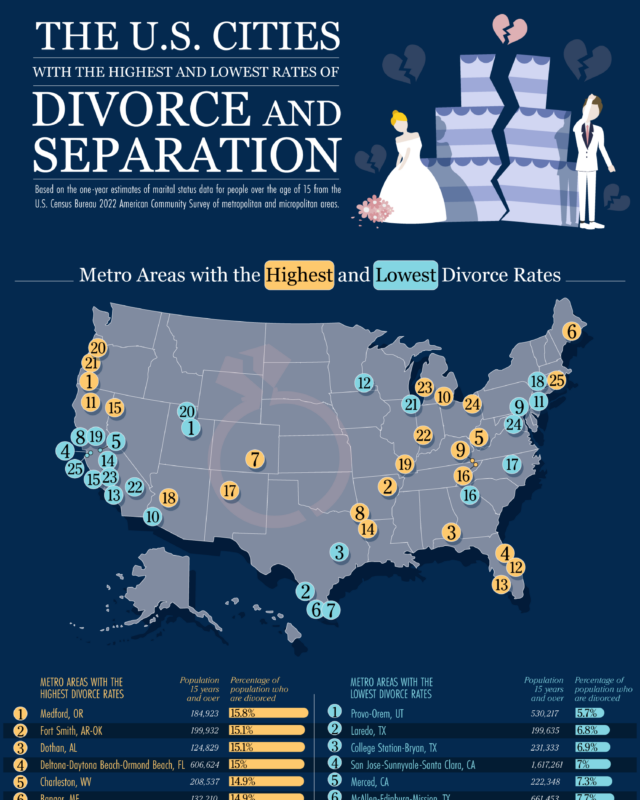
Fort Smith (Arkansas and Oklahoma) and Dothan (Alabama) follow at 15.1%.
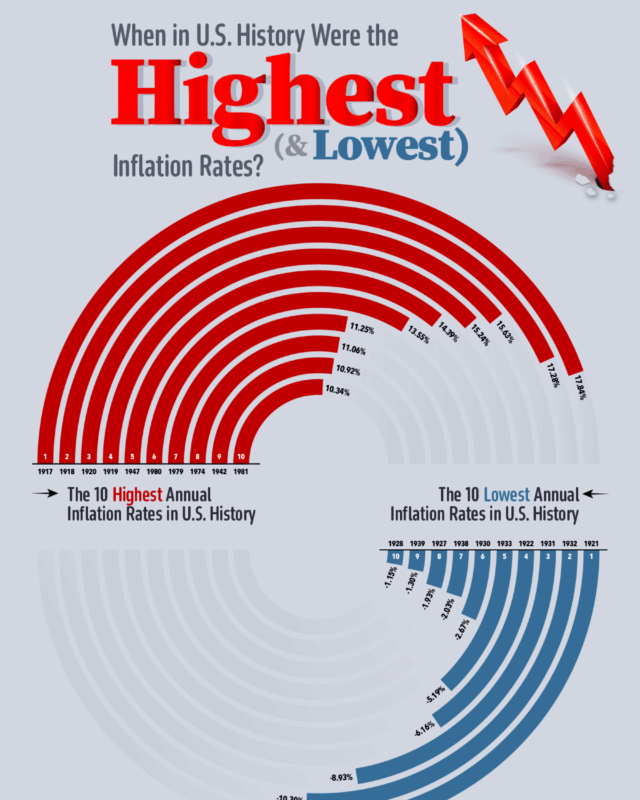
Prices rose fastest during and just after the First World War, peaking at 17.8% in 1917, and fell fastest in the slump of 1921 (minus 10.9%) and the Great…
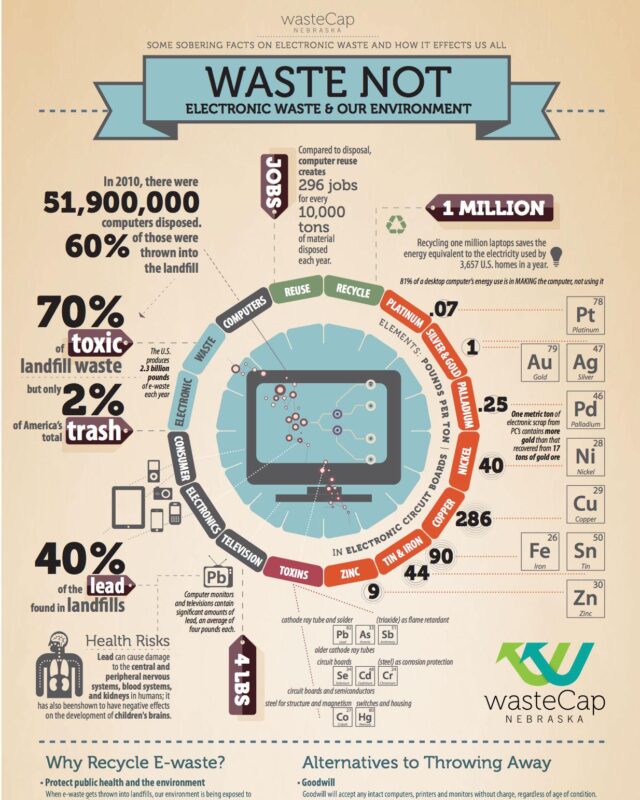
The world produced a record 62 million tonnes of e-waste in 2022, about 7.8 kg per person, but only 22.3% was documented as properly collected and recycled,…
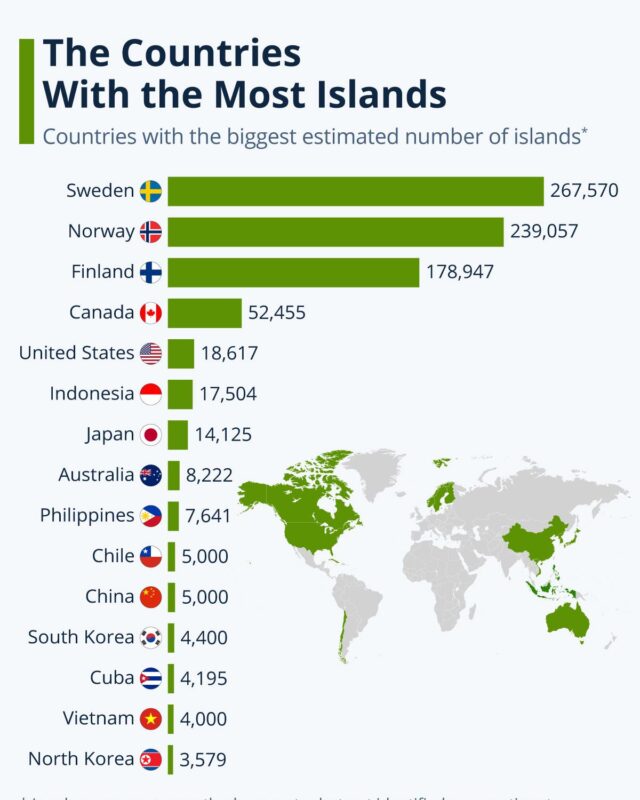
Norway is second with 239,057 and Finland third with about 198,000 on its latest count.
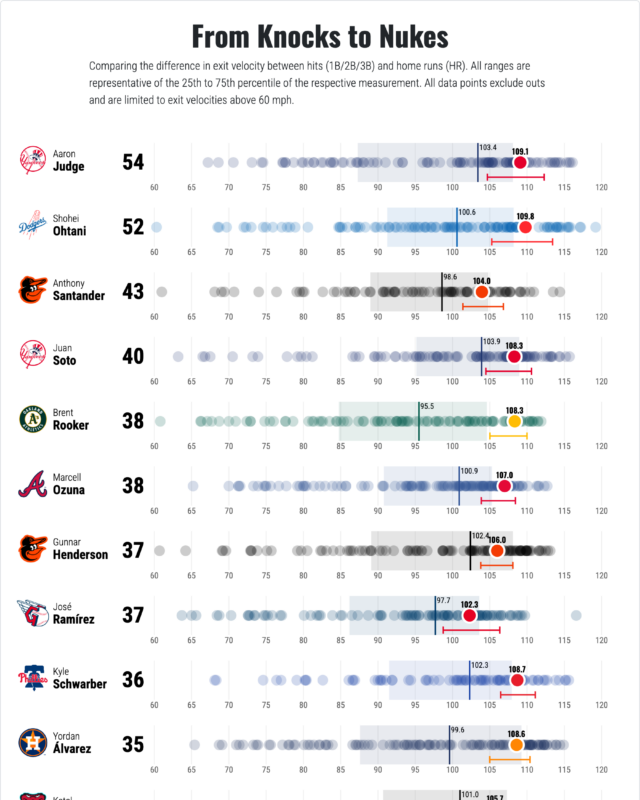
In MLB a ball hit at 95 mph or more counts as hard-hit, and the average batted ball travels at about 89 mph.
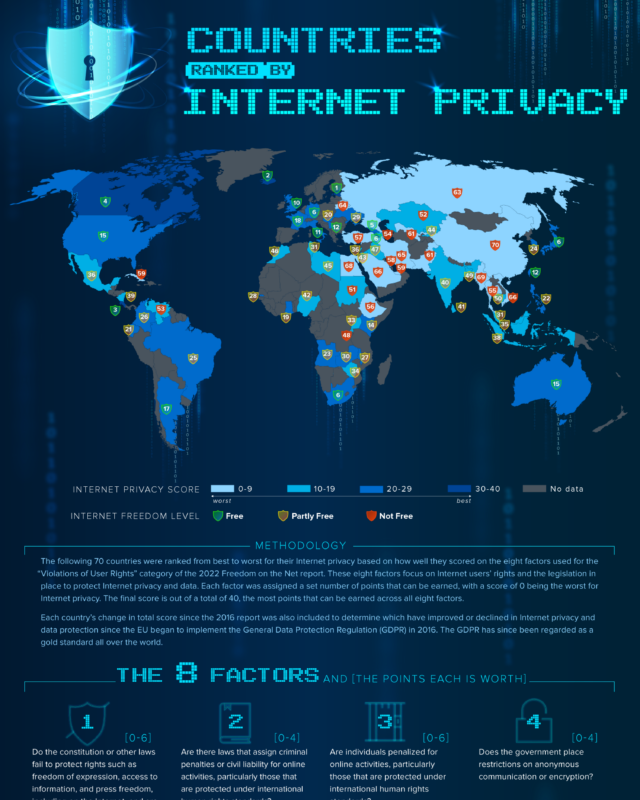
Estonia has the best internet privacy protection of the 70 countries assessed by Freedom House, scoring 37 out of 40 in a Stevens Institute of Technology…

In 1990, 93.5 of every 1,000 children worldwide died before their fifth birthday; by 2024 it was 37.4, a fall of about 60%.
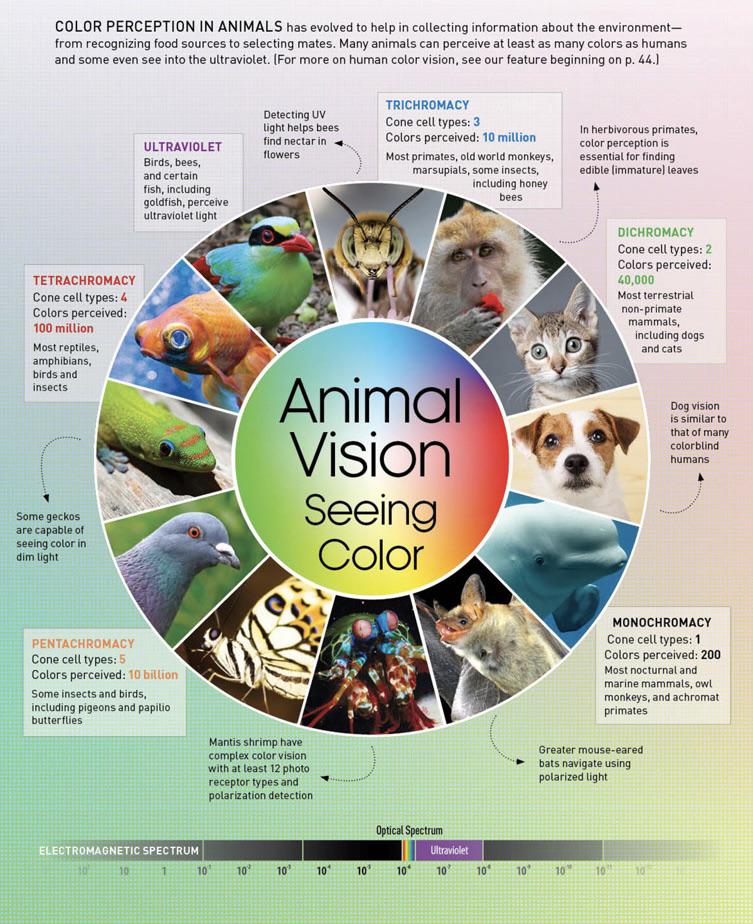
Animal colour vision depends on how many types of cone cell an animal has.
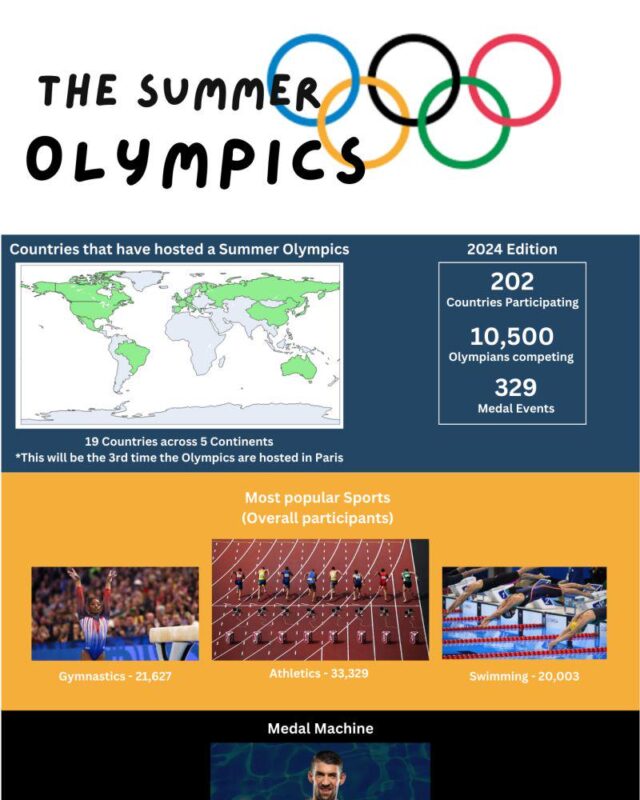
The United States sent the largest team with 592 athletes, followed by host nation France with 573, Australia with 459 and Germany with 428.

Turnout reached 66.4% of eligible citizens, the highest since 1900, yet about 81 million eligible Americans still did not vote.

A Boeing 787 is built from wings made in Japan, tail parts from Italy and doors from France and Sweden.
Every topic page starts with a short guide to the subject.







Give it a permanent page where people looking for your subject find it, with your name and a link to your site. Content marketers, agencies, designers and researchers all list here.