
Science
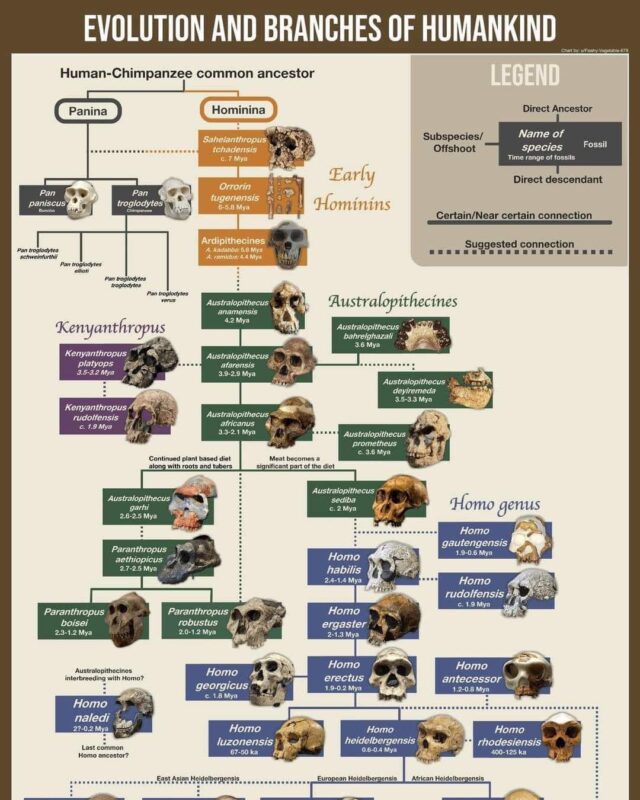
Evolution and Branches of Humankind, the Human Family Tree
Since our line split from chimpanzees about 7 million years ago, hominins have branched into early hominins, australopithecines, the robust Paranthropus and…
471 reviewed infographics. Search them, or narrow the list by topic and sort it the way you want.
Since our line split from chimpanzees about 7 million years ago, hominins have branched into early hominins, australopithecines, the robust Paranthropus and…
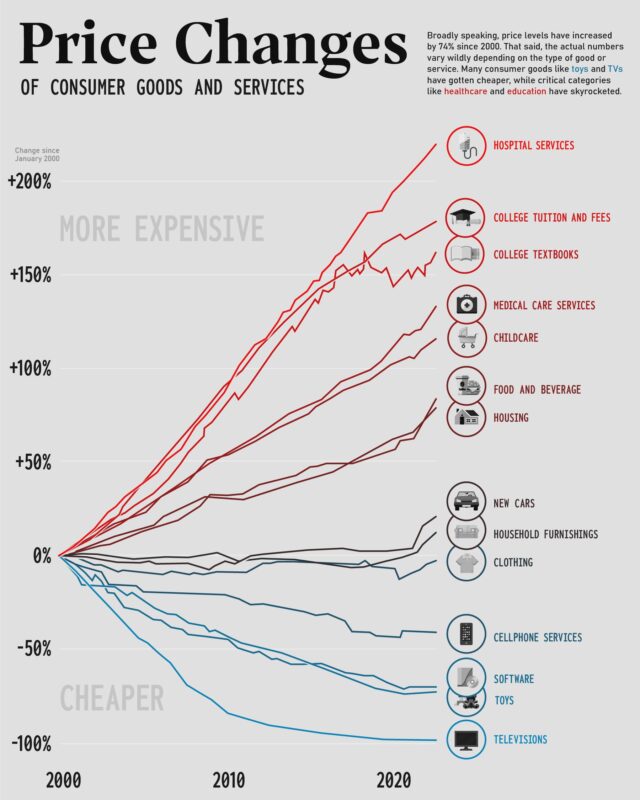
Services rose much faster: hospital services by 295%, college tuition by 208% and childcare by 166%.

About half of Mexican babies are now born by C-section, 51 in every 100 deliveries, and planned caesareans cluster in the morning, with 9am the busiest…
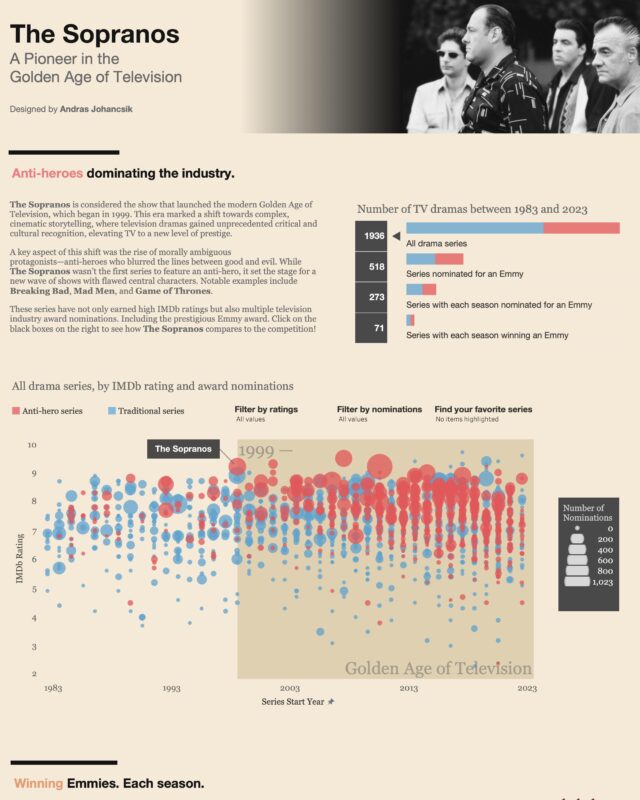
The show also won five Golden Globes and two Peabody Awards, and rates 92% on Rotten Tomatoes and about 9.2 on IMDb.

The Great Pyramid held the record for more than 3,800 years, cathedral spires took over from 1311, and in 1884 the 555 foot Washington Monument overtook…
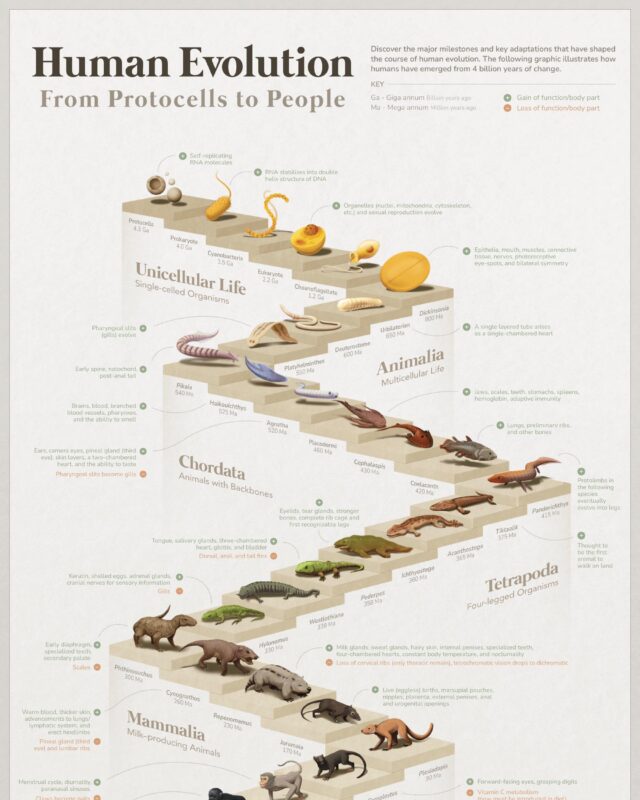
The human line split from the other African apes between 7 and 6 million years ago, upright walking evolved more than 4 million years ago, our genus Homo…
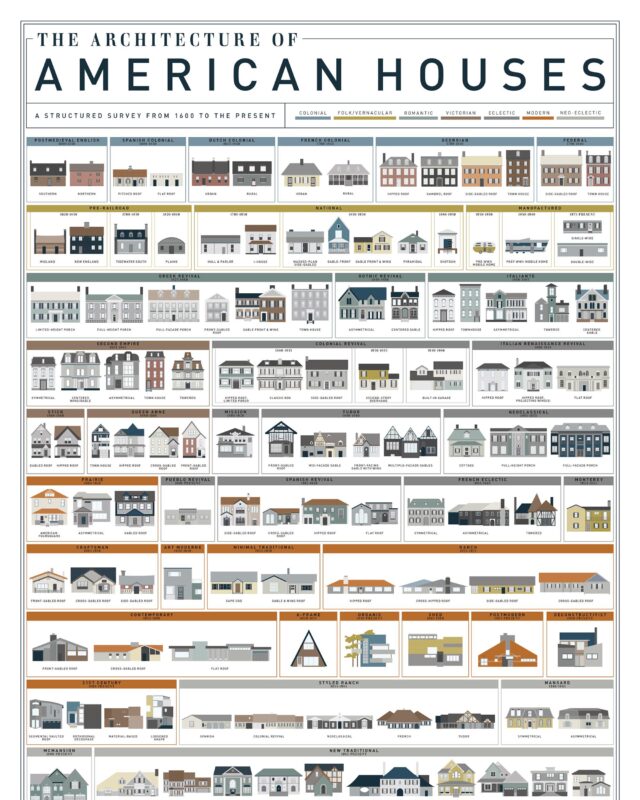
American architecture styles for houses fall into seven broad families that follow each other from the 1600s to today: Colonial, folk or vernacular,…
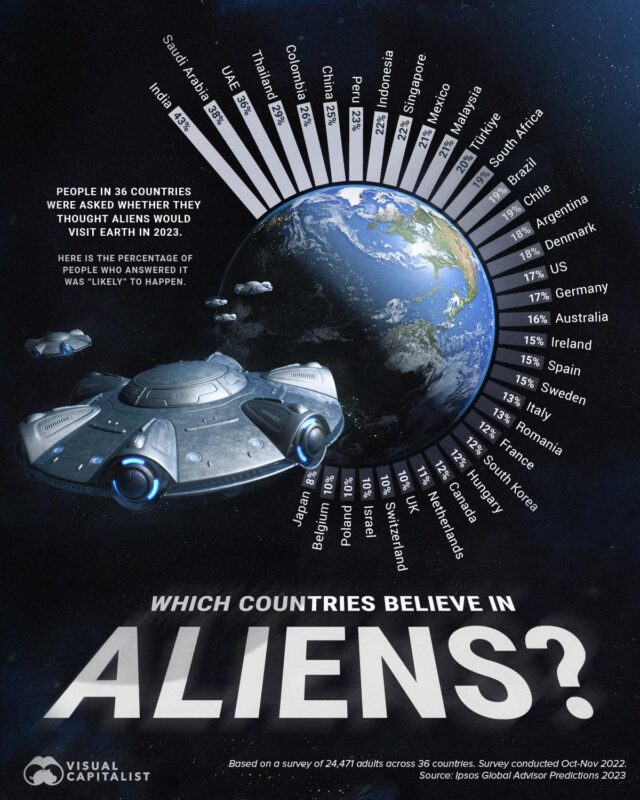
In an Ipsos survey of 36 countries, 43% of Indians said an alien visit in 2023 was likely, against a global average of 18%.

In the US they have gone opposite ways as employers: about 3.9 million tech software jobs against 556,000 in hardware manufacturing.

Halloween averages 39%, Saw 35%, The Texas Chainsaw Massacre 33% and Hellraiser 30%.
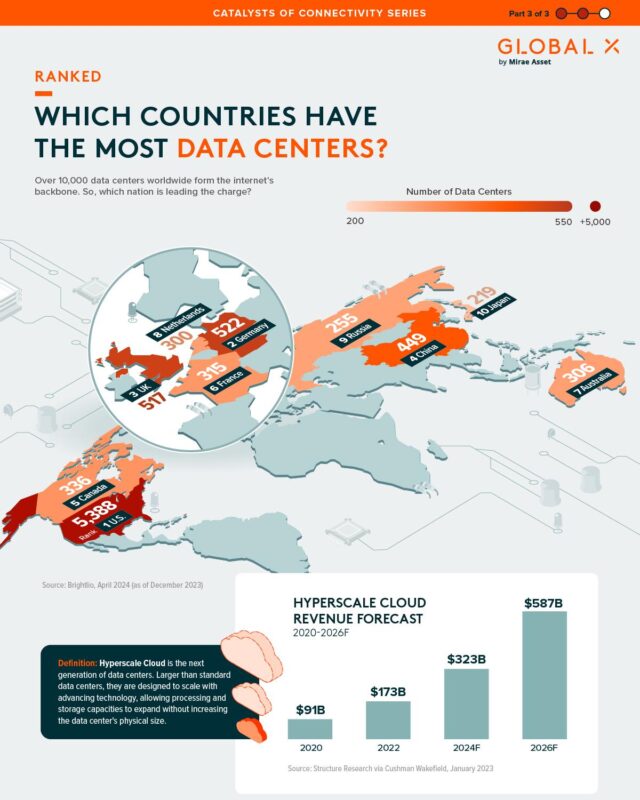
Germany (529), the United Kingdom (523), China (449) and Canada (337) follow.

In 2025 the median household in Massachusetts had $118,500 a year, about twice the $57,840 in Mississippi, against a US median of $87,460.

Their share of US jobs fell to 19% in the 1960s, peaked at 29% in the late 1980s as Baby Boomers reached that age, and has held near 22% since the 2000s.

Monopoly is the best selling board game with a known sales total, at an estimated 275 million copies since 1935, followed by Scrabble at about 150 million…

On 1 September 2026, UN Women counted 30 women leading 28 countries as head of state or head of government, and more have taken office since, including in…

In order came cosmic inflation in the first fraction of a second, the first protons and neutrons within a hundred-thousandth of a second, the first nuclei…

Japanese and Spanish are spoken fastest, at about 8 syllables a second, and Thai slowest at under 5, but slow languages pack more information into each…

This exoplanets infographic by Martin Vargic of Halcyon Maps paints more than 500 of those known in 2015, sorted by temperature and density, with the…

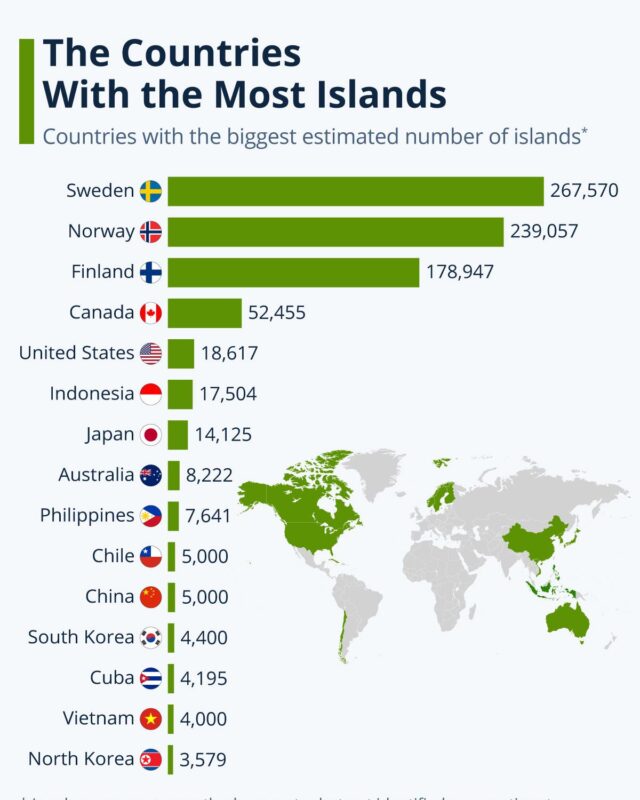
Honshu in Japan is second with about 102.6 million and Great Britain third with about 66 million.

This Visual Capitalist map shows the 2024 figures, when the range was $178K to $301K.
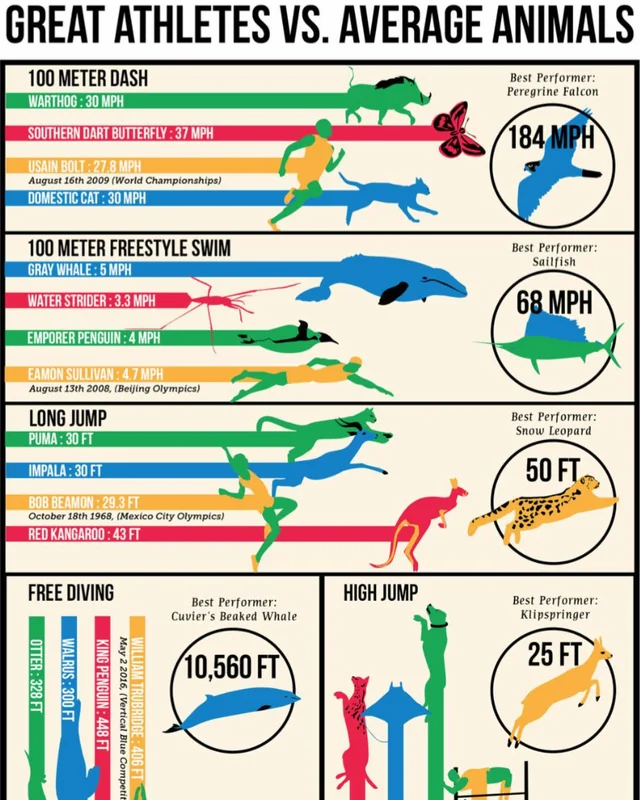
A cheetah runs at up to 65 mph against Usain Bolt's top speed of 27.56 mph, a red kangaroo can bound as far as the long jump world record, and Cuvier's…

This infographic by Dorothy Neufeld of Visual Capitalist shows all 20 risks from the Global Risks Report 2024.

Microsoft (140) and Cisco (134) come next, while Salesforce spent the most at $61.5 billion on just 63 deals.

On formal removals, Barack Obama deported the most, about 3.06 million over two terms.
Every topic page starts with a short guide to the subject.







Give it a permanent page where people looking for your subject find it, with your name and a link to your site. Content marketers, agencies, designers and researchers all list here.