

Internet and Social Media
Reddit IPO 2024 and the Founders Timeline From 2005
The shares were priced at $34 on 20 March, valuing the company at about $6.4 billion, and began trading on the New York Stock Exchange as RDDT on 21 March.
471 reviewed infographics. Search them, or narrow the list by topic and sort it the way you want.
The shares were priced at $34 on 20 March, valuing the company at about $6.4 billion, and began trading on the New York Stock Exchange as RDDT on 21 March.

At Paris 2024 Hong Kong paid the most, HK$6 million (about $768,000) for a gold medal, followed by Singapore at S$1 million (about $745,000).

Most medieval people worked the land as peasants, many of them serfs tied to a lord's manor.
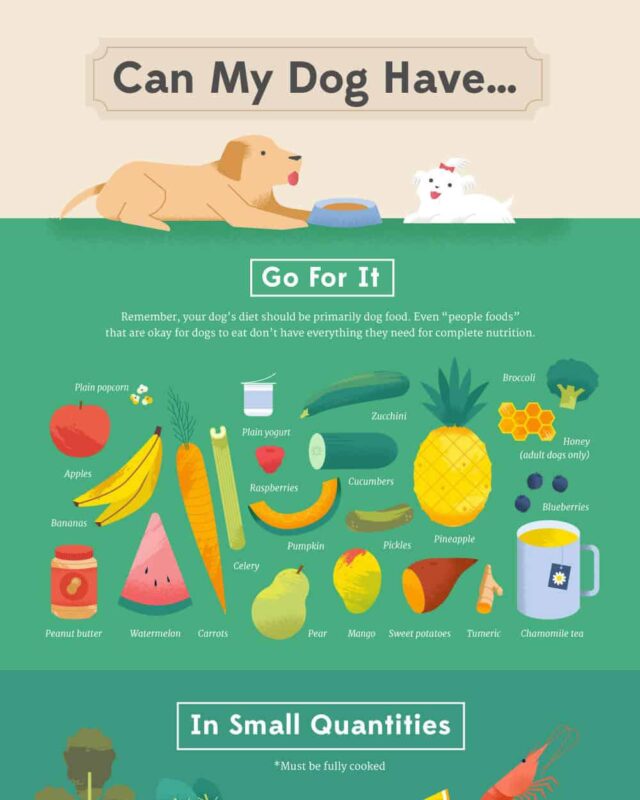
Dog food safety means knowing which foods can harm your dog and storing its food so it stays fresh and free of bacteria.
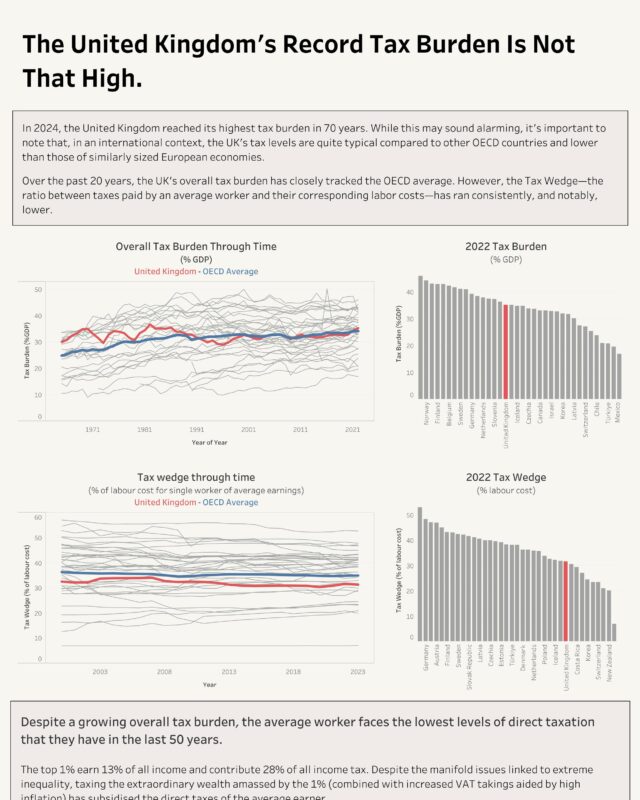
By the UK's own history it is high and rising: the OBR puts the tax take at 36.0% of GDP in 2025-26 and expects it to pass its historical high of 37.2% in…

Wyoming had the most at 3.82 visits per resident, followed by Washington, DC and Ohio, while Hawaii had the fewest at 0.60.

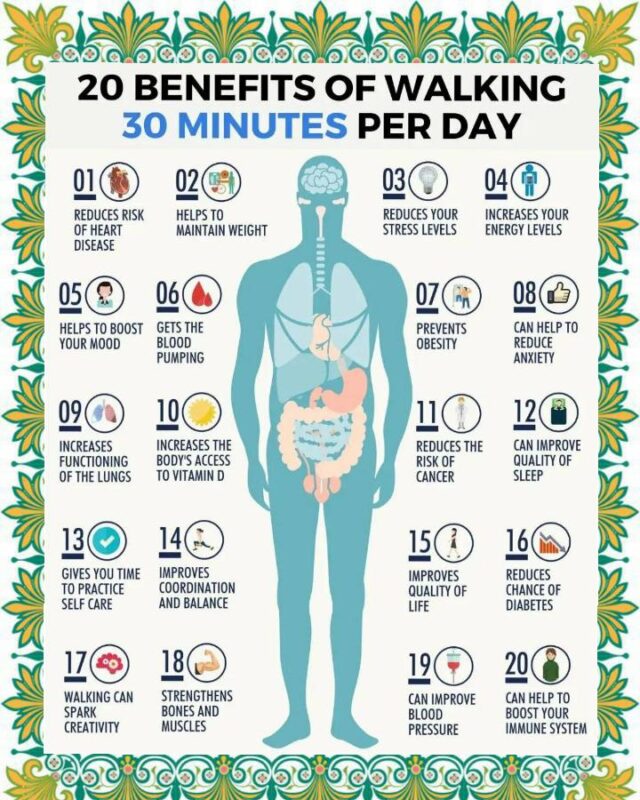
Thirty minutes on five days a week also meets the NHS target of 150 minutes of moderate activity.

In the UK the average is 178.2 cm (5 ft 10 in) and in the US 176.9 cm (5 ft 9.7 in).

It varies widely by country: about 163.9 cm (5 ft 4.5 in) in the UK, 163.3 cm (5 ft 4.3 in) in the US, 170.4 cm in the Netherlands, the tallest, and 150.9…
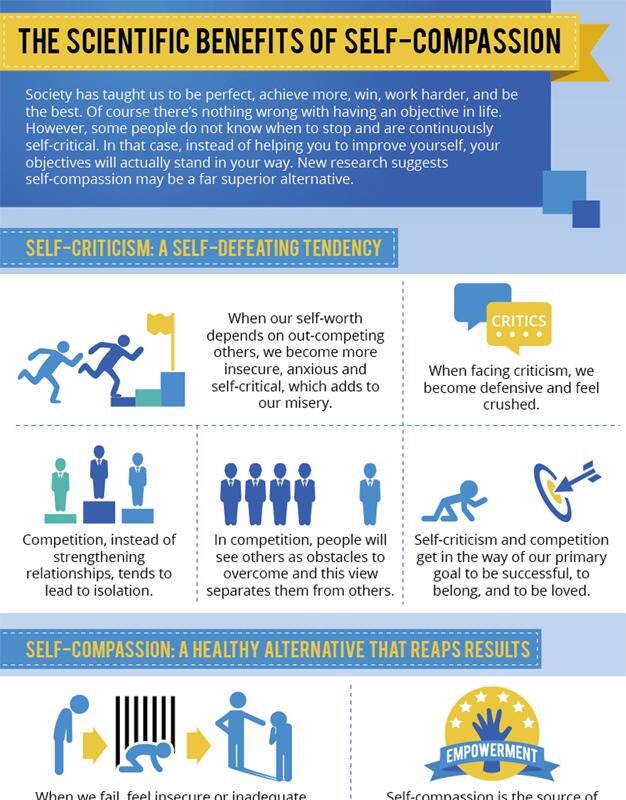
The benefits of self-compassion, according to research, include fewer mental health problems, higher wellbeing and life satisfaction, a calmer response to…

West Virginia, New Mexico, Kentucky, Arkansas and Alabama are also above 15%.
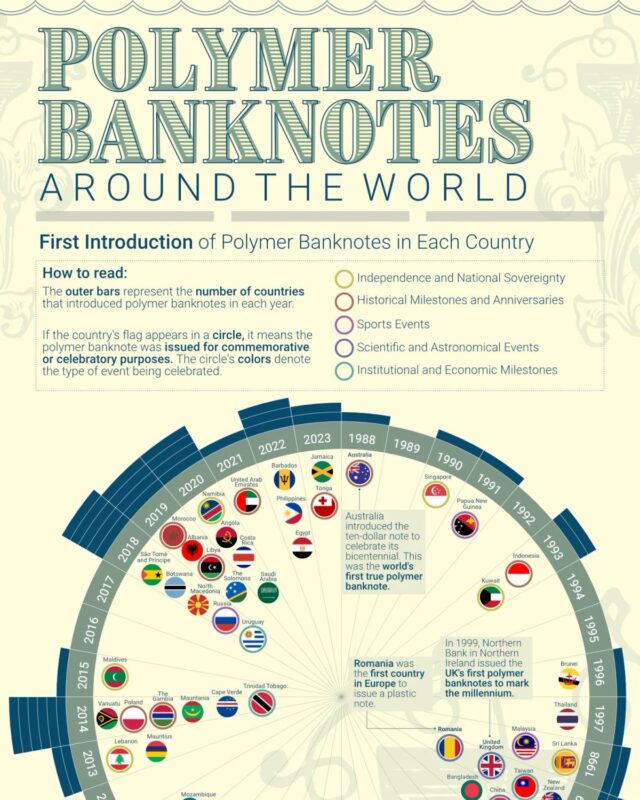
Australia issued the first in 1988, and by 2023 about 58 countries had introduced at least one.
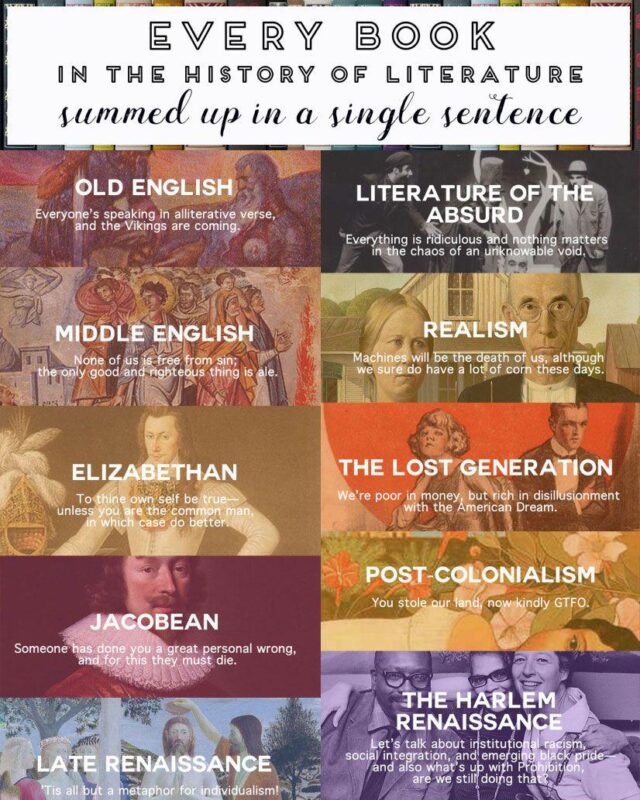
In English they run from Old English (7th century to after 1066) and Middle English, through the Renaissance, the Enlightenment, Romanticism and the…

In The Pudding's count of screenplay dialogue, 22 of 30 Disney and Pixar films had a male majority, and its chart of 31 films puts 23 in the group where men…

Relative to the size of their economies, the UAE attracted the most, scoring 14.8 on fDi Intelligence's greenfield FDI performance index, ahead of…

Some places set it at 16, 19, 20 or 21.
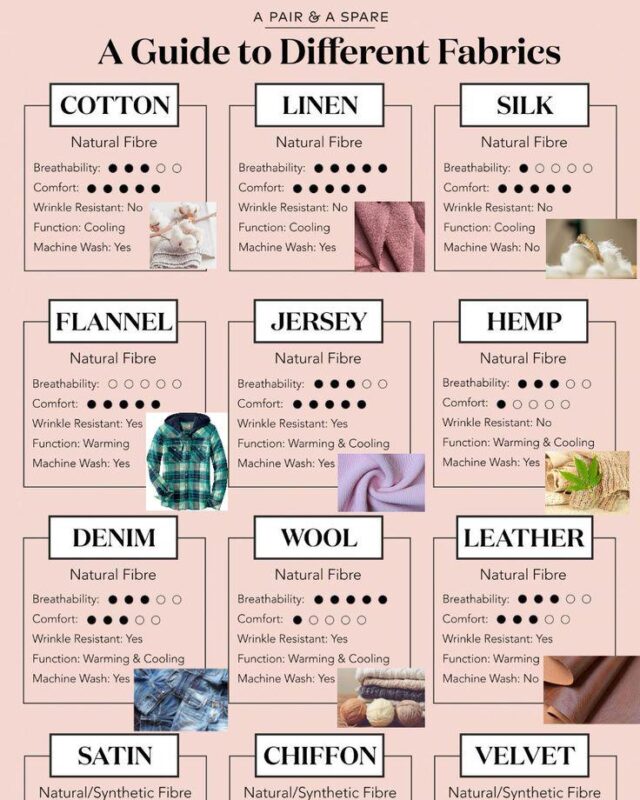
Fabrics are grouped by the fibre they are made from: natural fibres such as cotton, linen, wool and silk, synthetics such as polyester and nylon, and…

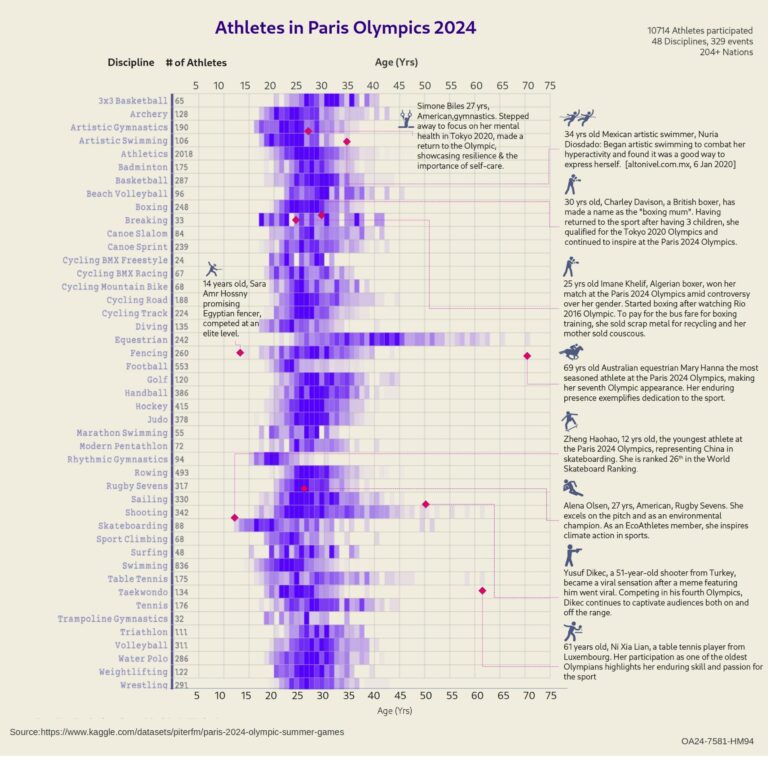
The United States sent the largest team with 592, ahead of host nation France with 573 and Australia with 459.

Before it came Kosovo (2008, not a UN member), Montenegro and Serbia (2006) and East Timor (2002).

Global natural gas production was about 392.7 billion cubic feet a day in 2023, roughly 4,060 billion cubic metres a year, and reached 4.34 trillion cubic…
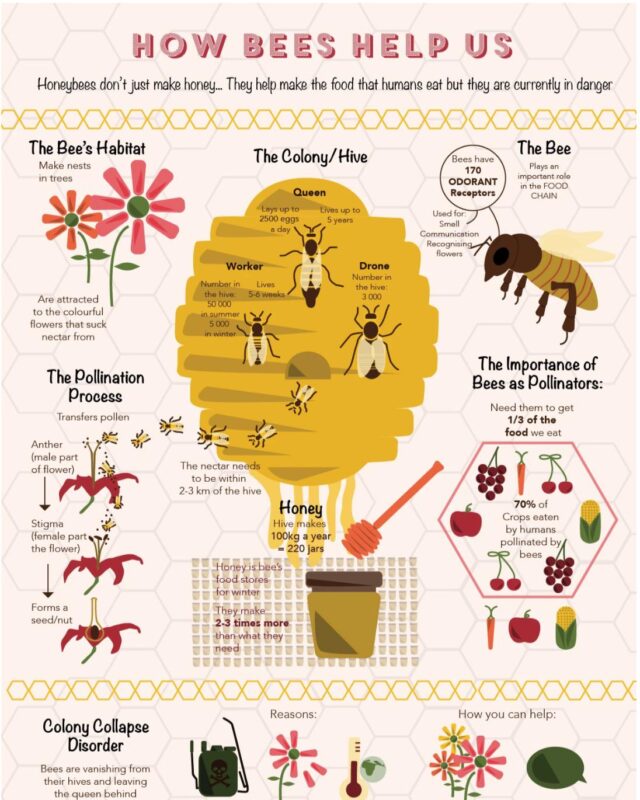
Bees help us mostly by pollinating crops.

On the 2026 list Amazon is first with $716.92 billion, just ahead of Walmart, then State Grid, UnitedHealth Group and Saudi Aramco.

The 4F trauma personality types are fight, flight, freeze and fawn, from psychotherapist Pete Walker's model of complex PTSD.

It also topped Paris 2024 with 126 medals, ahead of China with 91, though both won 40 golds.
Every topic page starts with a short guide to the subject.






Give it a permanent page where people looking for your subject find it, with your name and a link to your site. Content marketers, agencies, designers and researchers all list here.