
Entertainment
Highest Grossing Media Franchise Rankings, Pokémon to Barbie
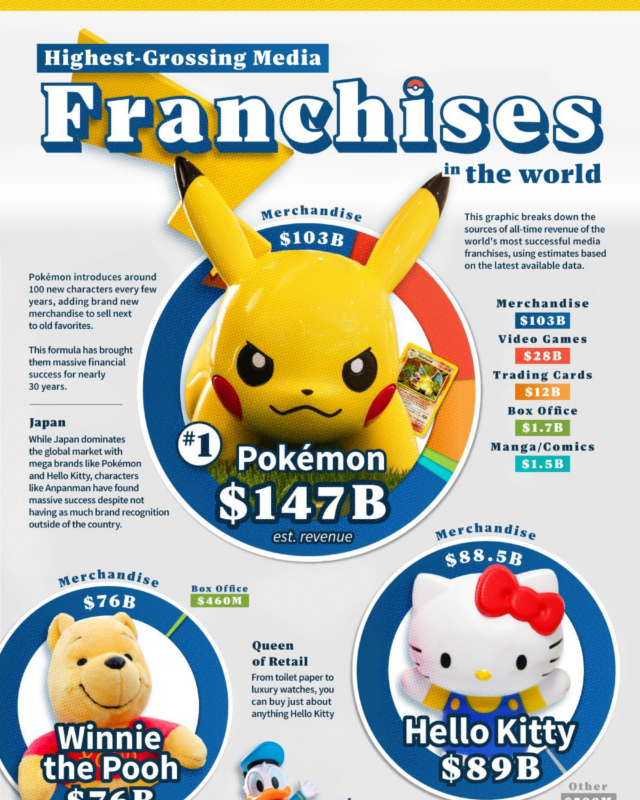
The graphic ranks 17 franchises and splits each total into sources such as merchandise, box office and video games.
These infographics cover companies and how they make money, including revenue and profit rankings, market value over time, product cost breakdowns, startup deals and survival rates, with a section on marketing and design. Each page credits the original creator, gives the full data as text and checks the headline figures against the source. Popular pages include Fortune Global 500 revenues compared with country GDP, the largest companies in the world by revenue, the largest companies by market cap in 1997 and 2025, the iPhone cost breakdown and Apple income and the six principles of graphic design.
The graphic ranks 17 franchises and splits each total into sources such as merchandise, box office and video games.

Of $69.7 billion in iPhone revenue, an estimated $42.2 billion went on cost of goods, led by the A17 Bionic chip at $9.5 billion.

World output more than tripled to about 1,864 million tonnes in 2020, with China rising from 14 to 1,053 million tonnes while US output fell.

It shows which countries make each part of a Boeing 787 Dreamliner, and who earns the money from a banana and an iPhone.

It shows an average discount of 34.23%, Indianwear and Westernwear making up two thirds of the catalogue, and watches averaging 8,657, the highest price of…

On the 2026 list Amazon is first with $716.92 billion, just ahead of Walmart, then State Grid, UnitedHealth Group and Saudi Aramco.
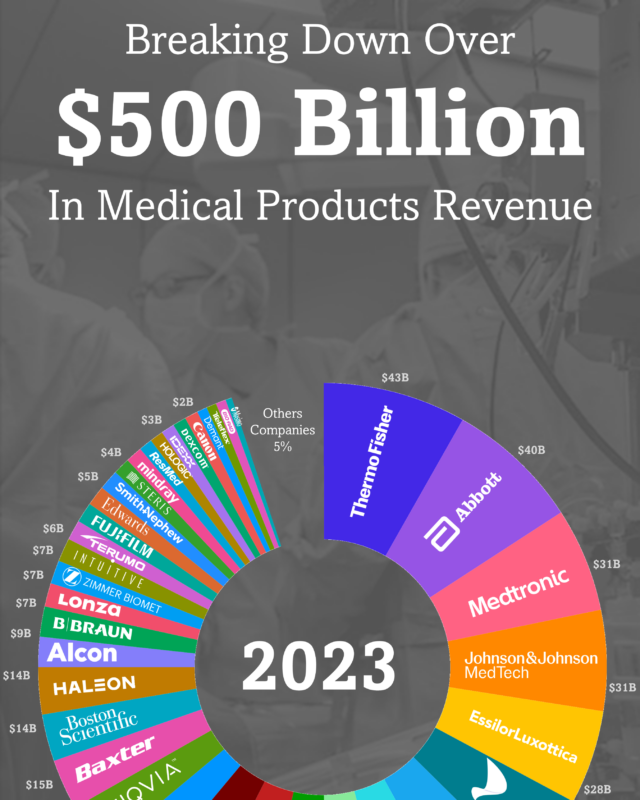
This revenue infographic by Reza Zahiri splits more than $500 billion of 2023 revenue between 37 companies.

EveryWatch's market report counted 742,592 watches listed for sale worth $11.3 billion in July 2024, with Rolex's Datejust, Daytona and Submariner the most…
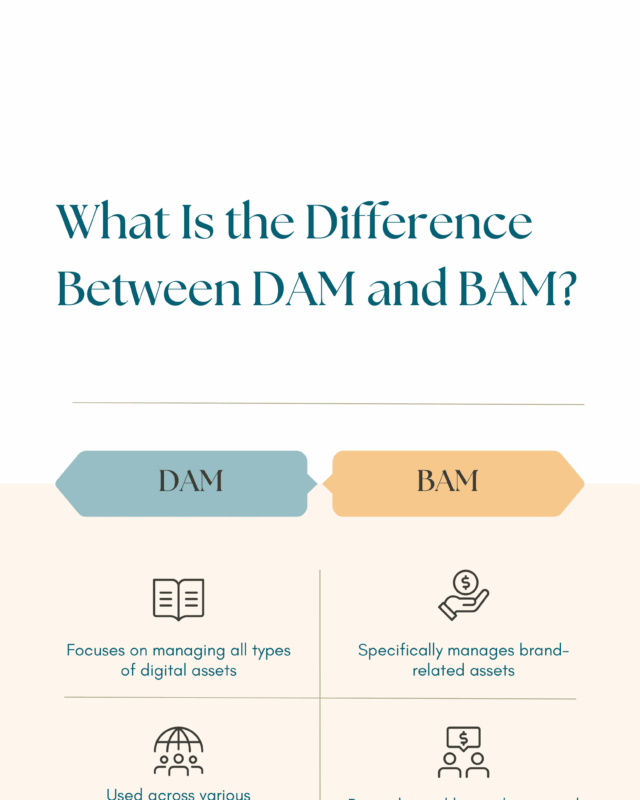
DAM (digital asset management) is software for storing, organising and sharing all of an organisation's digital files, used across many departments.

Cost of sales took $11.1 billion, research and development $13.3 billion and marketing, selling and administration $11.1 billion.

Research across 30 countries finds these links broadly shared but shaped by culture, so treat them as conventions, not rules.
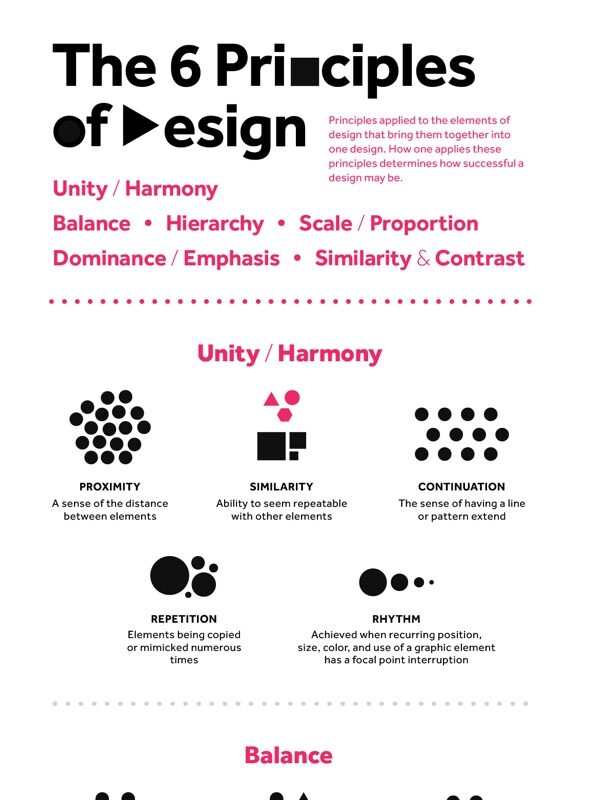
The six principles of graphic design are unity (or harmony), balance, hierarchy, scale (or proportion), dominance (or emphasis), and similarity and contrast.
The 30 infographics fall into four groups. Most rank companies by revenue, profit, margin or market value, from the world's largest firms to medical products makers and media companies. Others break down one company's results, such as Apple's iPhone quarter and Eli Lilly's second quarter of 2024, or track an industry, including steel production, US Toyota sales, Premier League club revenue and app spending. A third set covers startup acquisitions and survival rates, and the last explains working methods such as ETL, business intelligence and the 12 agile principles.
For the biggest firms, begin with Largest Companies in the World by Revenue, Top 35 from Visual Capitalist, where Walmart leads at $648 billion, followed by Amazon at $575 billion and State Grid of China at $546 billion. Its companion, Most Profitable Companies 2024, the Top 50 by Profit, uses the same Fortune data and puts Saudi Aramco first with $120.7 billion, ahead of Apple at $97.0 billion.
Yahoo Finance's Largest Companies by Market Cap in 1997 and in 2025 shows General Electric falling from 1st to 68th, while Microsoft rose from 5th to 3rd at $3.17 trillion. For one company in detail, Lirim Zenuni's iPhone Cost Breakdown and Apple Income, Q1 2024 estimates that $42.2 billion of $69.7 billion in iPhone revenue went on cost of goods, with the A17 Bionic chip the largest component at $9.5 billion.
On new businesses, Visual Capitalist's US Business Survival Rates by Industry, 2013 to 2023 finds that about one-third of private-sector businesses founded in 2013 were still operating after ten years, with agriculture and forestry best at 51% and mining, oil and gas worst at 25%. Startup Acquisitions, the 15 Companies That Bought the Most, also by Visual Capitalist, shows Alphabet making 222 deals worth $16.6 billion between 2000 and the first half of 2024, while Salesforce spent the most, $61.5 billion.
Pieces on design principles, logo colours, brand asset management and local marketing sit in the Marketing and Design section.
Walmart, at $648 billion, according to Visual Capitalist's Largest Companies in the World by Revenue chart. It uses Fortune figures for fiscal years ending by 31 March 2024, and Amazon is second at $575 billion.
About one-third of US private-sector businesses founded in 2013 were still operating in 2023, according to Visual Capitalist's US Business Survival Rates by Industry chart. The Bureau of Labor Statistics puts the figure at 34.7% for all private-sector establishments.
Pokémon, with estimated all time revenue of $147 billion, of which $103 billion came from merchandise, on the chart by Voronoi by Visual Capitalist. Hello Kitty is second at $89 billion.
Give it a permanent page where people looking for your subject find it, with your name and a link to your site. Content marketers, agencies, designers and researchers all list here.