
Energy
US Energy Sources and Consumption by Sector
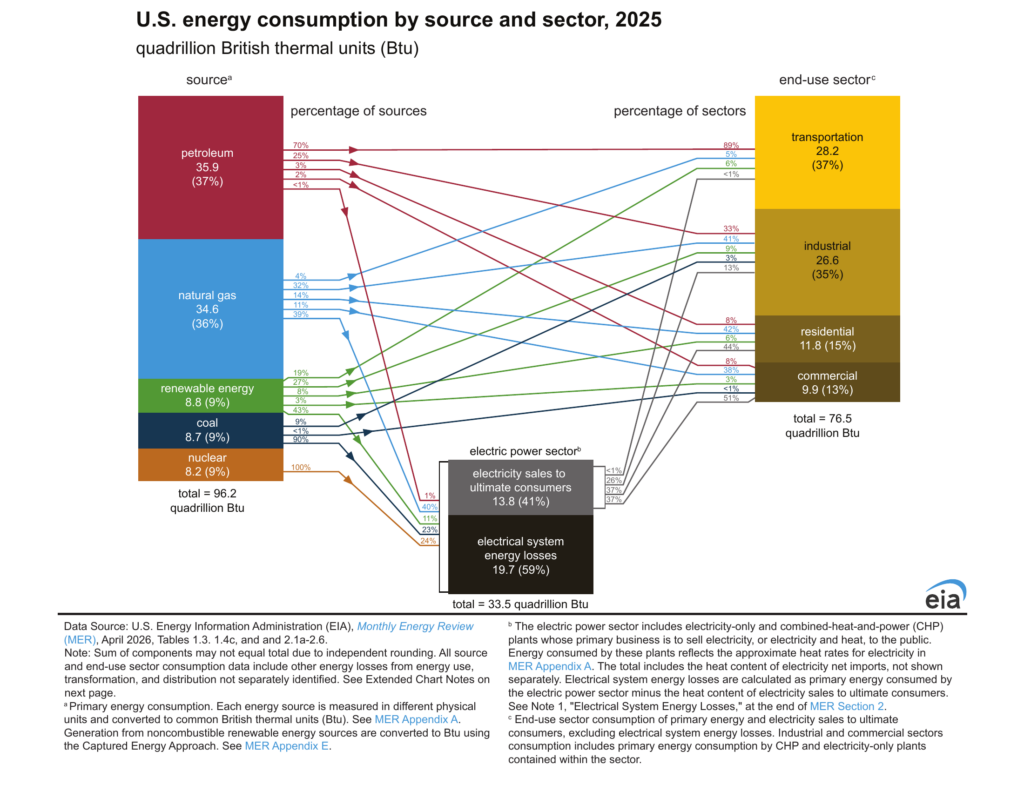
In 2025 the country used 96.5 quadrillion British thermal units (quads) of primary energy, and petroleum supplied 37% of it, natural gas 36%, renewables 9%,…
This section covers where energy comes from and who uses it, including oil reserves and production, natural gas, fossil fuel consumption, electricity prices and energy use per person. Each page gives the full figures as text and checks them against sources such as the Energy Institute, the EIA and Eurostat. Start with the largest oil reserves by country, oil production by country on a world map, natural gas production by country, fossil fuel consumption by country or German electricity prices compared with the EU.
In 2025 the country used 96.5 quadrillion British thermal units (quads) of primary energy, and petroleum supplied 37% of it, natural gas 36%, renewables 9%,…
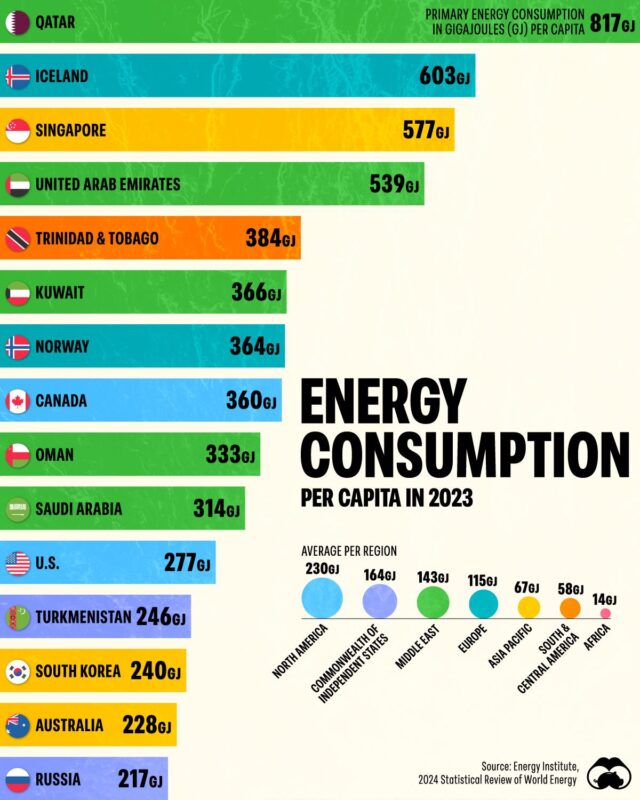
The US uses about 270 GJ per person and the UK about 90 GJ, according to the Energy Institute's 2026 Statistical Review of World Energy as published by Our…
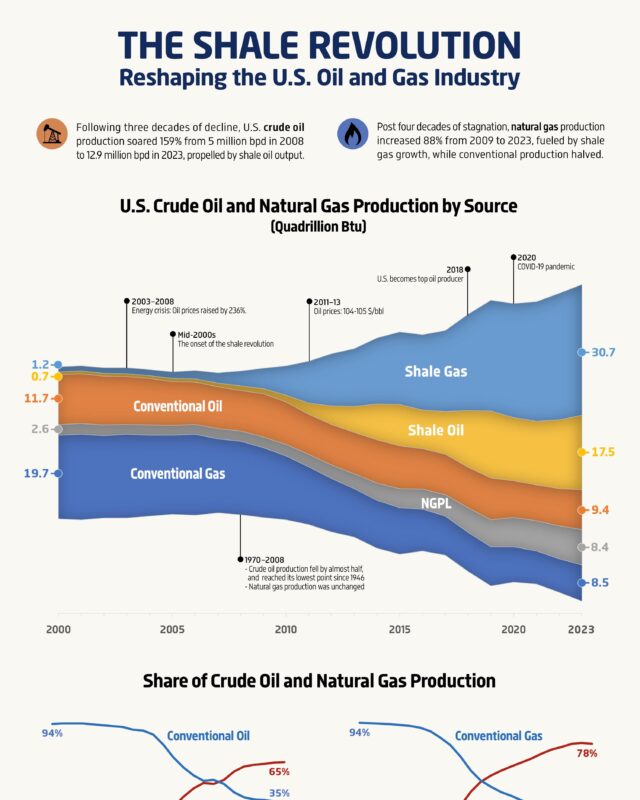
The United States produced a record 13.66 million barrels of crude oil a day and 39.3 trillion cubic feet of natural gas in 2025, according to the US Energy…

The United States produced a record 13.6 million barrels of crude oil a day in 2025, about 40% more than Russia or Saudi Arabia, according to the US Energy…

In 2023 it produced 12.9 million barrels of crude oil a day, ahead of Russia (10.6 million) and Saudi Arabia (9.6 million), out of a world total of about…

In 2025 the United States imported 6.17 million barrels of crude a day and exported 3.96 million, leaving net imports of 2.21 million barrels a day,…

Russia is the largest supplier, sending 2.19 million barrels a day in 2024, ahead of Saudi Arabia, Malaysia and Iraq.

That is the second highest in the EU after Ireland (39.2 cents) and about a third above the EU average of 28.8 cents.

In 2024 China bought 4,057 million barrels of crude, about 11.1 million barrels a day, and Russia supplied 803 million barrels, 19.8% of the total.

Clean sources produced 42% of China's electricity in 2025 and coal generation fell for the first time since 2015, but coal is still the largest single source.

Energy Information Administration figures, followed by Saudi Arabia with 267 billion and Iran with 209 billion.

On the Energy for Growth Hub's chart, income accounts for about 80% of the variation in electricity use between countries, and every country above $30,000…
Most of the 14 infographics here deal with oil: reserves, production by country and by US state, the US crude trade balance, China's crude imports and the price of oil against gold. Others cover natural gas production and the growth of US shale. A third group compares how much energy and fossil fuel each country uses, per person and in total. The rest look at electricity, from household prices in the EU to the link between national income and electricity use, and one graphic compares China's provinces on the energy transition.
For oil supply, begin with Largest Oil Reserves by Country, the Top 10 Ranked by Civixplorer. Using EIA figures for 2023, it puts Venezuela first with 304,000 million barrels. Ehsan Soltani of Econovis made Oil Production by Country 2023 on a World Map, where the United States leads with 12,927 thousand barrels per day out of a world total of 82,757. His US Oil Production Compared to Other Countries, by State 2023 shows that Texas alone, at 5,512, out-produced every country except Russia and Saudi Arabia.
Two Econovis charts follow China's crude imports. China Oil Imports by Country, Crude Oil Sources in 2024 shows China buying 4,057 million barrels in 2024, with Russia supplying 803 million. China Crude Oil Imports by Supplier, 2000 to 2024 traces growth from about 1.4 million to 11.1 million barrels a day.
On consumption, Top Countries by Fossil Fuel Consumption in 2023 from Elements by Visual Capitalist shows China using 140 exajoules, almost as much as the 146 used by every country outside the top 12. For electricity, Germany Electricity Prices Compared With the EU in 2024 by DataPulse Research puts German households at 41.0 euro cents per kWh in the first half of 2024, the highest in the EU, against 10.9 cents in Hungary.
The US crude oil trade balance chart from Econovis runs from 1920 to 2024. For the 12 months to November 2024, it shows exports of 4.17 million barrels a day and imports of 6.58 million.
Venezuela, with 304,000 million barrels (about 304 billion) of proven reserves in the EIA figures for 2023 used in the Civixplorer chart Largest Oil Reserves by Country, the Top 10 Ranked. Saudi Arabia is second with 267,000 million barrels and Iran third with 209,000 million.
The United States, with 12,927 thousand barrels per day of crude oil and condensate in 2023, which is 15.6% of the world total. That figure comes from Ehsan Soltani's Econovis map Oil Production by Country 2023 on a World Map, where Russia is second with 10,554 and Saudi Arabia third with 9,609.
Qatar, at 817 gigajoules per person in 2023, almost three times the US figure of 277 GJ. The Visual Capitalist chart Energy Consumption per Capita in 2023, Top 15 Countries ranks Iceland, Singapore and the United Arab Emirates next.
Give it a permanent page where people looking for your subject find it, with your name and a link to your site. Content marketers, agencies, designers and researchers all list here.