Key points from the chart
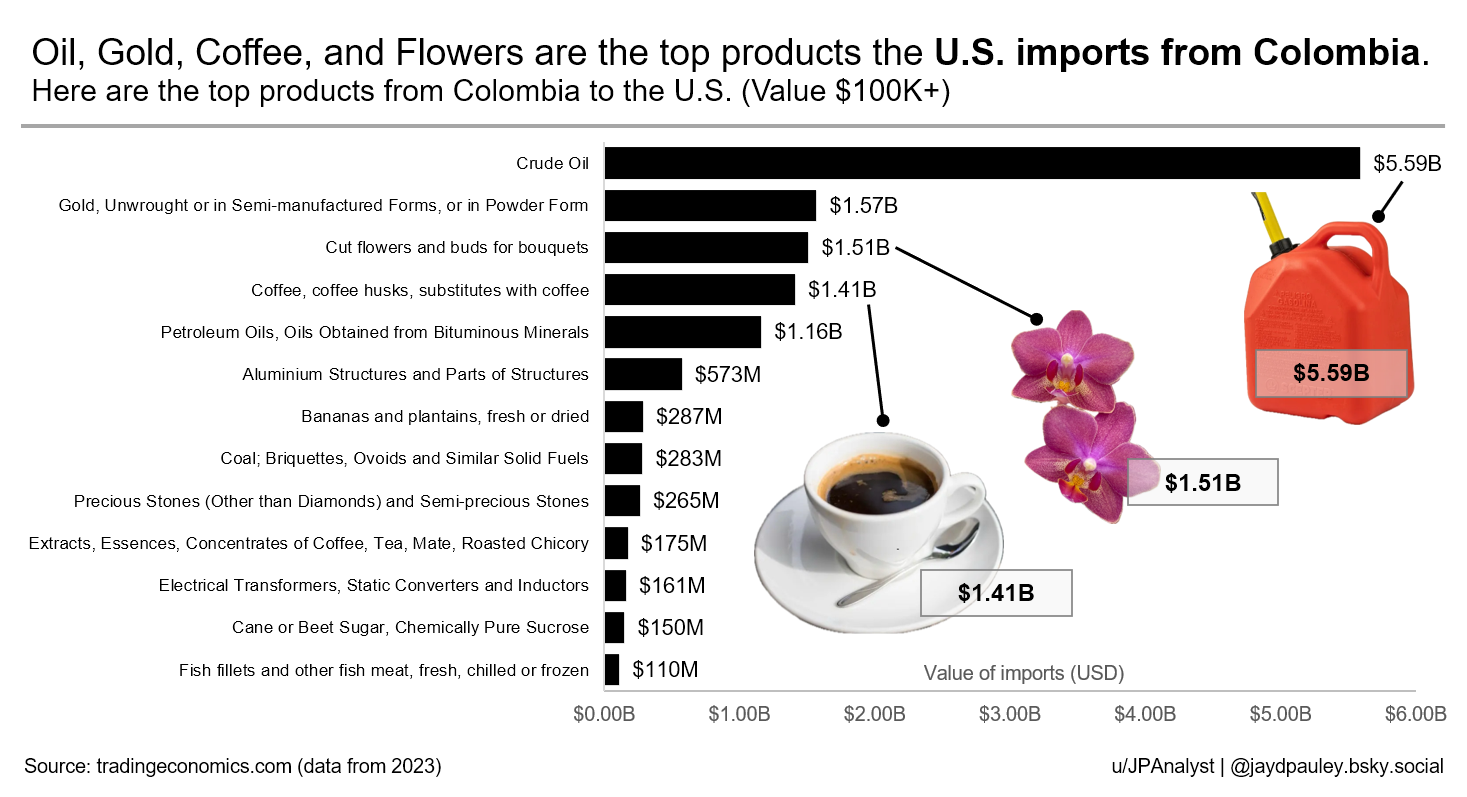
- Crude oil is by far the largest US import from Colombia on the chart, at $5.59 billion in 2023.
- Gold ($1.57 billion), cut flowers ($1.51 billion) and coffee ($1.41 billion) form a close second group.
- Crude oil is about 42% of the $13.2 billion total of the 13 products shown (our sum).
- With refined petroleum oils and coal added, fuels make up over $7 billion of the listed imports.
- The smallest product shown is fish fillets, at $110 million.
US imports from Colombia in text
Title: Oil, Gold, Coffee, and Flowers are the top products the U.S. imports from Colombia. Subtitle: Here are the top products from Colombia to the U.S. (Value $100K+). The chart is a horizontal bar chart in black with the axis Value of imports (USD), from $0.00B to $6.00B. Photos of a red fuel can, pink orchids and a cup of coffee point to the crude oil, cut flowers and coffee bars. Footer: Source, tradingeconomics.com (data from 2023). Credit, u/JPAnalyst and @jaydpauley.bsky.social.
| Rank | Product (as labelled) | US imports from Colombia, 2023 |
|---|---|---|
| 1 | Crude Oil | $5.59B |
| 2 | Gold, Unwrought or in Semi-manufactured Forms, or in Powder Form | $1.57B |
| 3 | Cut flowers and buds for bouquets | $1.51B |
| 4 | Coffee, coffee husks, substitutes with coffee | $1.41B |
| 5 | Petroleum Oils, Oils Obtained from Bituminous Minerals | $1.16B |
| 6 | Aluminium Structures and Parts of Structures | $573M |
| 7 | Bananas and plantains, fresh or dried | $287M |
| 8 | Coal; Briquettes, Ovoids and Similar Solid Fuels | $283M |
| 9 | Precious Stones (Other than Diamonds) and Semi-precious Stones | $265M |
| 10 | Extracts, Essences, Concentrates of Coffee, Tea, Mate, Roasted Chicory | $175M |
| 11 | Electrical Transformers, Static Converters and Inductors | $161M |
| 12 | Cane or Beet Sugar, Chemically Pure Sucrose | $150M |
| 13 | Fish fillets and other fish meat, fresh, chilled or frozen | $110M |
What the US imports from Colombia now
Trading Economics, the chart’s source, publishes the same series from the UN Comtrade database. Its latest figures are for 2025, when US imports from Colombia totalled $18.58 billion [1]. It groups goods into broader two digit categories than the chart, so oil and refined products sit together under mineral fuels, and gold sits with gemstones and coins.
| Category (HS chapter) | US imports from Colombia, 2025 |
|---|---|
| Mineral fuels, oils, distillation products | $6.44B |
| Coffee, tea, mate and spices | $2.76B |
| Pearls, precious stones, metals, coins | $1.95B |
| Live trees, plants, bulbs, roots, cut flowers | $1.66B |
| Commodities not specified according to kind | $777.34M |
| Edible fruits, nuts, peel of citrus fruit, melons | $659.95M |
| Aluminum | $653.62M |
| Total, all goods | $18.58B |
The order is much the same as on the chart. Fuels still lead by a wide margin, gold and precious metals, cut flowers and coffee follow, and aluminium is still the largest manufactured product [1]. Coffee, tea and spices is larger in 2025 than coffee alone was on the chart, partly because the category is wider.
How the products group together
The chart’s pictures mark the three products that stand out: oil, flowers and coffee. Cut flowers and coffee each passed a billion dollars of US sales on the chart for 2023, and both did so again in 2025 [1]. Bananas and plantains, coffee extracts, sugar and fish add to a long list of food exports.
Fuels are the largest single block. Crude oil, refined petroleum oils and coal together come to about $7.0 billion on the chart (our sum). Gold and other precious and semi-precious stones add another $1.8 billion.
Notes on this infographic
- Value threshold. The subtitle says Value $100K+, but the smallest bar is $110 million. The chart shows the top 13 products, which are all far above $100,000.
- Product groups. The labels are customs product headings, so related goods are split. Crude oil and petroleum oils are separate bars, as are coffee and coffee extracts.
- Older article. An earlier version of this page described textiles as a key import. Textiles and clothing are not on the chart, and in 2025 knitted and woven clothing came to about $105 million each [1].
Questions about US imports from Colombia
What does the US import from Colombia?
Mostly fuels, gold, cut flowers and coffee. In 2023 the chart shows crude oil at $5.59 billion, gold at $1.57 billion, cut flowers at $1.51 billion and coffee at $1.41 billion. In 2025, total US imports from Colombia were $18.58 billion [1].
What does Colombia export to the US?
The same list read the other way. Colombia’s largest exports to the United States are mineral fuels, coffee, tea and spices, precious metals and stones, and live plants and cut flowers, according to the 2025 Trading Economics data [1].
How much crude oil does the US import from Colombia?
US imports of crude oil from Colombia were worth $5.59 billion in 2023, by far the largest product on the chart. That is about 42% of the $13.2 billion total of the 13 products shown. With refined petroleum oils ($1.16 billion) and coal ($283 million) added, fuels come to about $7.0 billion. In 2025 mineral fuels and oils totalled $6.44 billion [1].
How much are US cut flower imports from Colombia worth?
The US imported $1.51 billion of cut flowers and buds for bouquets from Colombia in 2023, the third largest product on the chart after crude oil and gold. In 2025 the wider category of live trees, plants, bulbs, roots and cut flowers came to $1.66 billion [1]. Cut flowers passed a billion dollars of US sales in both years [1].
Sources
- Trading Economics, United States Imports from Colombia, UN Comtrade data, the chart’s stated source.
- Jayd Pauley (JPAnalyst), JPAnalyst on Medium, the creator’s profile.
Last reviewed 30 October 2026