How big is the US trade deficit with China?
The US goods trade deficit with China was $202.7 billion in 2025, down from a peak of $418.2 billion in 2018, according to the US Census Bureau. In the first nine months of 2026 it was $131.5 billion. The US deficit with the European Union was larger in 2025, at $220.3 billion, the first year since the Census EU series began in 1997 that it topped the China figure.
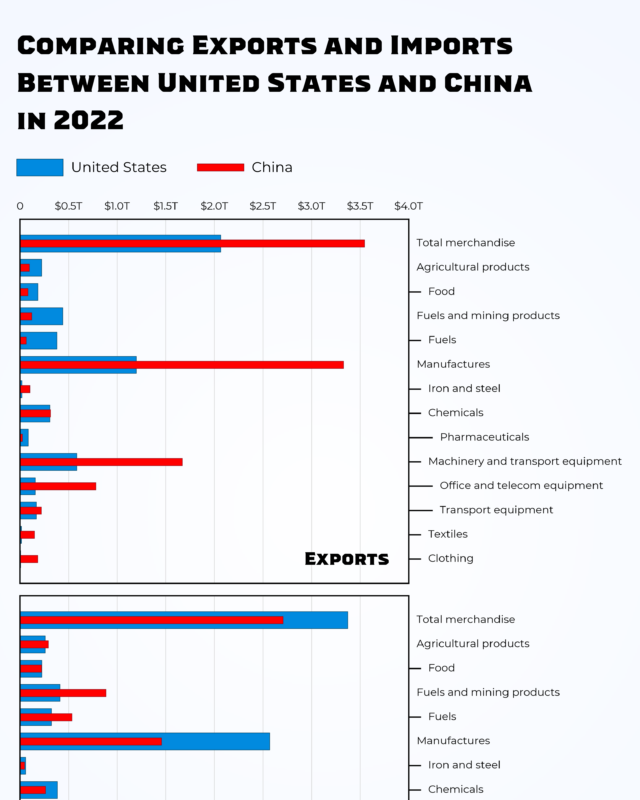
Those are bilateral figures, the gap between what the US sells to a partner and what it buys from it [2][3]. The infographic by Econovis measures something different and bigger. It compares each economy’s balance in manufactured goods with the whole world, and in 2023 that was a deficit of $1.22 trillion for the US against surpluses of $1.81 trillion for China and $0.44 trillion for the EU, using WTO data [1]. The two sets of numbers answer different questions, so both are covered below.
US trade deficit with China by year
The table gives US goods trade with China for selected years, with the US deficit with the EU alongside for comparison. Figures are in billions of US dollars, not adjusted for inflation [2][3].
| Year | US exports to China | US imports from China | Balance with China | Balance with the EU |
|---|---|---|---|---|
| 1990 | 4.8 | 15.2 | -10.4 | n/a |
| 1995 | 11.8 | 45.5 | -33.8 | n/a |
| 2000 | 16.2 | 100.0 | -83.8 | -58.7 |
| 2005 | 41.2 | 243.5 | -202.3 | -124.5 |
| 2008 | 69.7 | 337.8 | -268.0 | -95.8 |
| 2010 | 91.9 | 365.0 | -273.0 | -79.7 |
| 2015 | 115.9 | 483.2 | -367.3 | -155.9 |
| 2018 | 120.3 | 538.5 | -418.2 | -168.4 |
| 2019 | 106.5 | 449.1 | -342.6 | -177.7 |
| 2020 | 124.6 | 432.5 | -308.0 | -182.6 |
| 2021 | 151.4 | 504.2 | -352.8 | -218.1 |
| 2022 | 154.0 | 536.3 | -382.3 | -202.1 |
| 2023 | 147.6 | 427.2 | -279.6 | -207.7 |
| 2024 | 143.3 | 440.3 | -297.0 | -236.7 |
| 2025 | 106.0 | 308.7 | -202.7 | -220.3 |
| 2026 (Jan to Sep) | 83.5 | 215.0 | -131.5 | -75.6 |
The deficit with China grew almost every year from the late 1980s to 2018, when imports from China reached $538.5 billion. It has fallen in most years since. Imports from China in 2025 were 43% lower than at the 2018 peak, and US exports to China fell too, to $106.0 billion, the lowest since 2011 (our arithmetic from the Census tables) [2].
China’s share of the total US trade deficit
China used to account for close to half of the whole US goods deficit. In 2015 the China deficit was 49% of the total and in 2018 it was 48%. By 2025 the share was down to 16%, and in the first nine months of 2026 it was 14% (our arithmetic from Census totals for all countries) [2][4].
The overall deficit did not shrink as the China figure fell. The total US goods deficit on a Census basis rose from $870.4 billion in 2018 to $1,234.6 billion in 2025 [4]. Much of the trade moved to other Asian suppliers instead of coming back to the US. The US deficit with Vietnam went from $39.5 billion in 2018 to $178.3 billion in 2025, and with Taiwan from $15.2 billion to $146.6 billion [5][6].
In 2025 China still had the largest deficit of any single country, just ahead of Mexico ($197.0 billion) and Vietnam ($178.3 billion) [2][5][7]. In the first nine months of 2026 it had dropped to fourth, behind Vietnam ($190.9 billion), Mexico ($184.0 billion) and Taiwan ($171.1 billion) [5][6][7].
Tariffs and the US China trade deficit
The fall from 2018 lines up with the trade war. The first US tariffs, 25% on $34 billion of Chinese goods, took effect on 6 July 2018, and China answered with tariffs on a similar value of US goods [8]. In April 2025 US tariffs on Chinese goods were raised to 145%, and China raised its own to 125%. A truce on 12 May 2025 cut the US rate to 30% and China’s to 10% [8]. In February 2026 the US Supreme Court struck down the tariffs that had been imposed under the International Emergency Economic Powers Act [8].
You can see the 2025 swings in the monthly data. US imports from China were $41.8 billion in January 2025, ahead of the April tariff rises, and fell to $18.9 billion in June [2]. In 2026 they have been rising month by month, from $19.0 billion in February to $31.5 billion in September, the highest monthly figure since February 2025 [2]. If that carries on, the 2026 deficit could end the year closer to the 2025 total than the year to date suggests.
The US trade deficit with the EU
The EU is the larger trading partner of the two by value. US goods trade with the EU (exports plus imports) came to $1,045 billion in 2025, against $415 billion with China (our sums of the Census totals) [2][3]. The deficit with the EU rose from $58.7 billion in 2000 to a record $236.7 billion in 2024 [3].
The 2025 EU figure was pushed up by a surge in imports early in the year. US imports from the EU were $83.8 billion in March 2025, compared with $54.2 billion in February, before falling back [3]. In 2026 the EU deficit has narrowed sharply, to $75.6 billion for January to September against $184.4 billion in the same months of 2025 (our sum of the monthly figures) [3]. Exports to the EU are up and imports are down.
Manufactured goods, where the gap is widest
The Econovis chart looks at manufactured goods only, and on that measure the gap between the three economies is much starker. China’s surplus in manufactures with the world grew slowly until it joined the World Trade Organization in 2001 and then took off, and Econovis says it “grew dramatically from 2000 to 2022” [1]. The US deficit in manufactures has deepened since the 1990s, which Econovis links to China’s rise as a manufacturing power, while the EU has kept “a relatively stable surplus” [1].
The chart’s title writes China’s surplus as “$1,81 Trillion”. It means $1.81 trillion, as the Econovis post confirms [1]. Because the chart leaves out fuels, farm goods and services, its figures are not the same as the total trade balances you see in the news.
What a trade deficit means
The trade balance is exports minus imports, so a deficit means a country buys more from a partner than it sells to it [9]. The headline bilateral figures cover goods. Services such as tourism, education, software and finance are counted separately, so the goods figure is not the whole picture. The St. Louis Fed notes that a trade deficit is not in itself a sign of a weak economy [9]. A bilateral deficit also says little on its own, because supply chains run through several countries before goods reach US shops.
Questions about the US China trade deficit
What is the US trade deficit with China in 2026?
$131.5 billion for January to September 2026, down from $161.1 billion in the same months of 2025 (our sum of the Census monthly figures) [2].
When was the US trade deficit with China the highest?
In 2018, at $418.2 billion, when US imports from China peaked at $538.5 billion [2].
Who does the US have the biggest trade deficit with?
Counting the EU as one, the EU had the largest deficit in 2025 at $220.3 billion. Of single countries, China was largest in 2025 at $202.7 billion, but in the first nine months of 2026 Vietnam, Mexico and Taiwan were all higher [2][3][5][6][7].
Does the US have a trade deficit with the EU?
Yes, in goods. It was $220.3 billion in 2025 and $75.6 billion in the first nine months of 2026 [3].
How much does China export to the US?
US imports from China were $308.7 billion in 2025 and $215.0 billion from January to September 2026, on US Census figures [2].
Sources
- Econovis, U.S. $1.22 Trillion Manufactured Goods Trade Deficit in 2023 vs. EU $0.44 Trillion Surplus and China’s $1.81 Trillion Surplus. The creator’s post with this chart, WTO data.
- US Census Bureau, Trade in Goods with China, data to September 2026.
- US Census Bureau, Trade in Goods with European Union, data to September 2026.
- US Census Bureau, Trade in Goods with World, Census basis.
- US Census Bureau, Trade in Goods with Vietnam.
- US Census Bureau, Trade in Goods with Taiwan.
- US Census Bureau, Trade in Goods with Mexico.
- Wikipedia, China and United States trade war.
- FRED Blog, Federal Reserve Bank of St. Louis, Demystifying the trade balance.
Last reviewed 10 November 2026