What does the US import from Canada?
The US imports mainly energy, vehicles and industrial goods from Canada. Crude oil, natural gas and other fuels make up about 30% of the total, followed by cars and car parts, machinery, plastics, gold, lumber and aluminium. In 2025 US goods imports from Canada came to $381.9 billion, down 7.2% on 2024, and Canada was the third largest source of US imports in 2024.
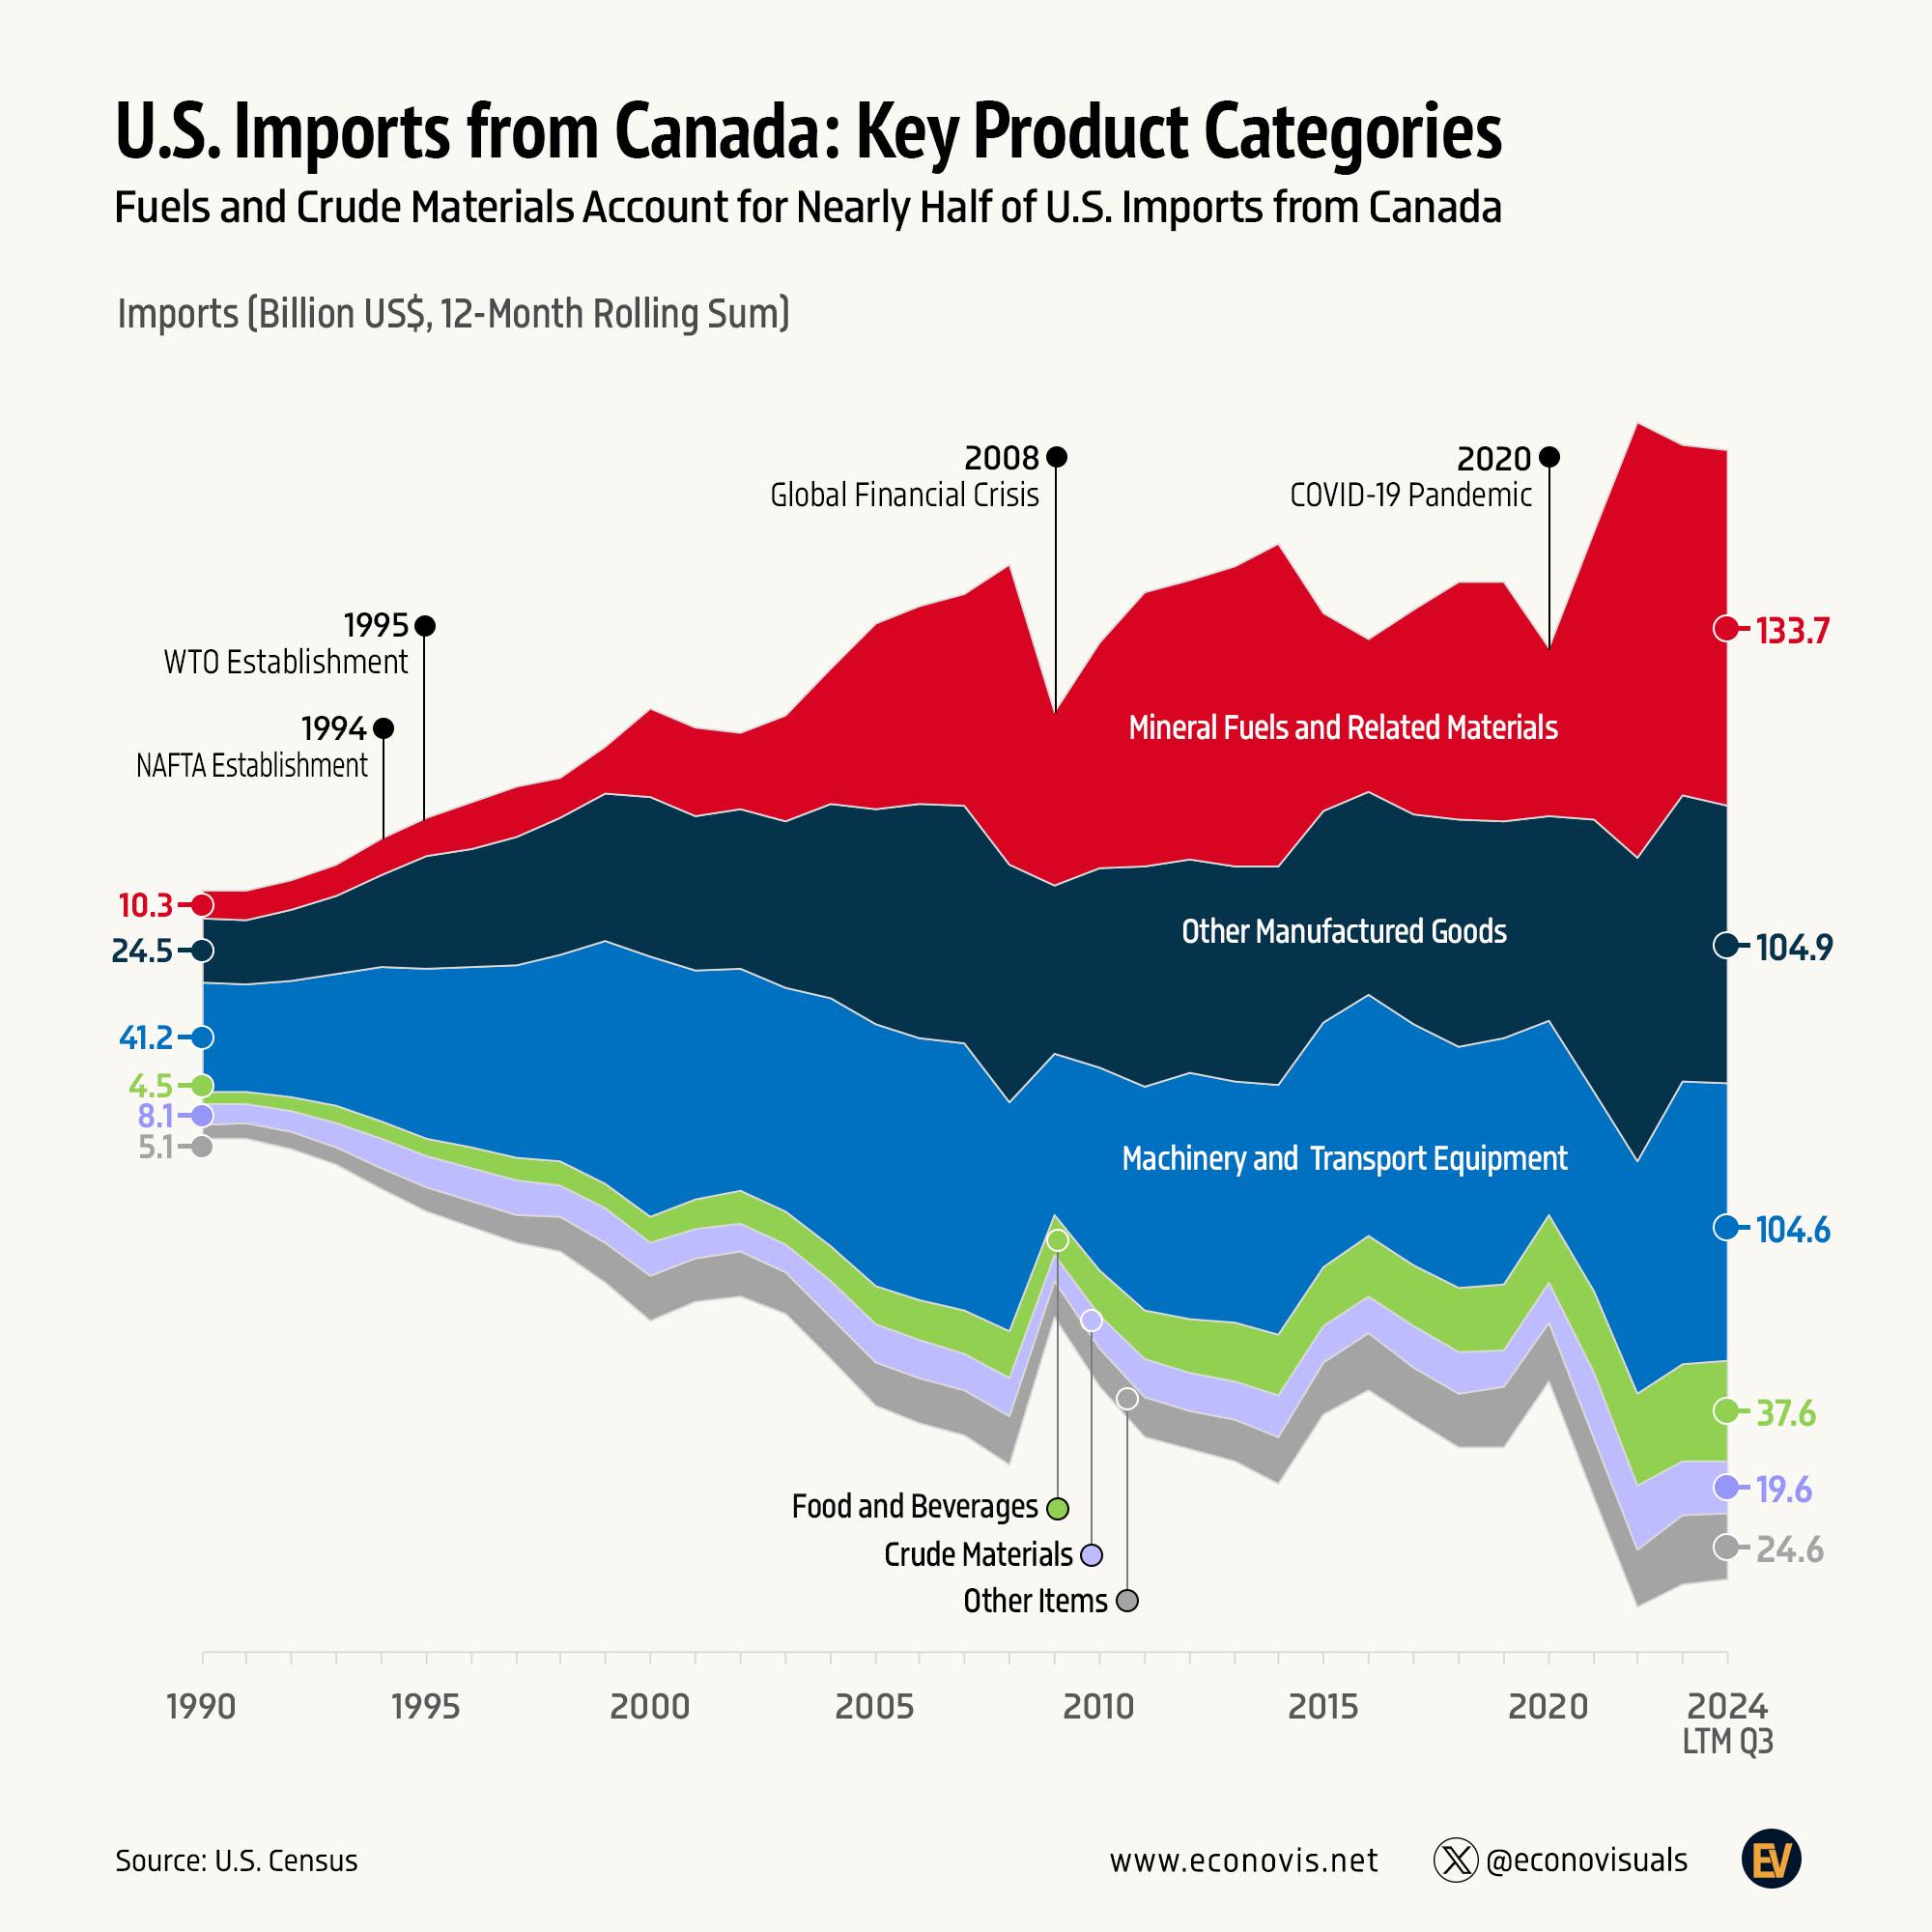
The infographic by Econovis shows how that mix has changed since 1990 using US Census Bureau data. Its main point is that energy has overtaken manufactured goods as the largest category [1]. This article covers what the US buys from Canada today, product by product, and how the trade has shifted.
Top US imports from Canada by product
These were the largest product groups (two-digit HS codes) in US imports from Canada in 2025, from the US data reported to the UN Comtrade database [4]. Comtrade values imports on a slightly different basis from the Census headline figure, so its total is a little higher ($392 billion), but the ranking and shares are what matter here.
| Product group | 2025, billion US$ | Share of imports from Canada |
|---|---|---|
| Mineral fuels and oils (crude oil, natural gas, refined products, electricity) | 119.0 | 30.3% |
| Vehicles and parts | 45.8 | 11.7% |
| Machinery, engines and computers | 30.1 | 7.7% |
| Special classification provisions | 21.0 | 5.4% |
| Plastics | 12.8 | 3.3% |
| Gold, precious metals and stones | 11.6 | 2.9% |
| Electrical machinery and equipment | 11.1 | 2.8% |
| Wood and lumber | 10.2 | 2.6% |
| Aluminium | 9.7 | 2.5% |
| Aircraft and parts | 9.1 | 2.3% |
| Bakery, cereal and pasta products | 6.6 | 1.7% |
| Paper and paperboard | 6.6 | 1.7% |
The top three groups account for about half of everything the US imports from Canada. Fuels alone are worth more than vehicles, machinery and plastics put together.
Energy is the biggest US import from Canada
Canada is by far the largest foreign supplier of energy to the US. In 2025 the US imported 3.91 million barrels a day of crude oil from Canada, 63% of all US crude imports, according to the US Energy Information Administration (EIA) [5]. In 1990 the figure was 643,000 barrels a day, about 11% of crude imports [5]. Most of that growth came from the Alberta oil sands, much of whose heavy crude is shipped by pipeline to US refineries in the Midwest and on the Gulf Coast.
Natural gas is even more one-sided. Of the 3.16 trillion cubic feet of gas the US imported in 2025, 3.15 trillion (over 99%) came from Canada by pipeline [6]. The same fuels group also includes refined products such as petrol and diesel, and electricity from Canadian hydroelectric dams.
This is what drives the Econovis graphic. Fuels and related materials were worth $10.3 billion of US imports from Canada in 1990 and $133.7 billion in the 12 months to September 2024, about 13 times as much [1]. Energy imports also swing with prices, which is why they fell sharply in 2009, 2015 and 2020 and peaked in 2022.
Cars, parts and machinery
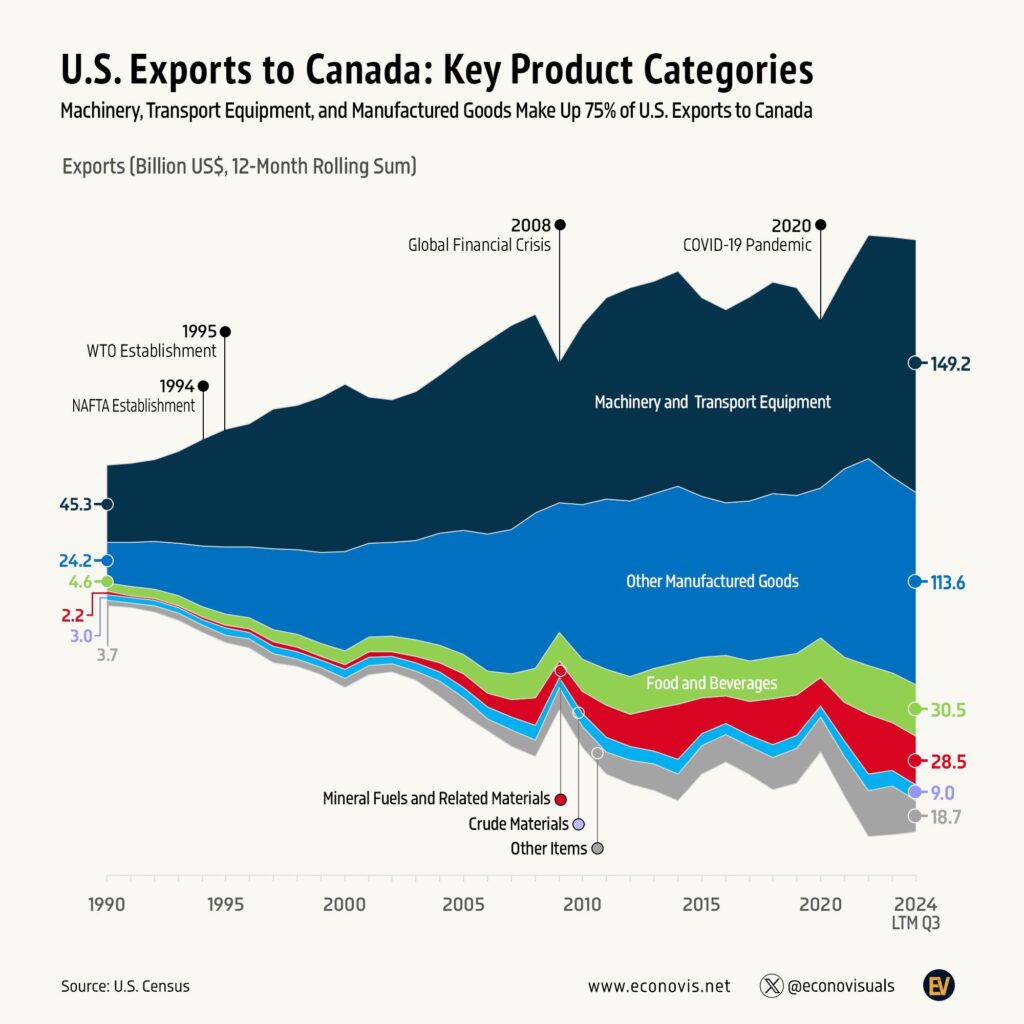
Car production in the US and Canada (mainly Ontario) has worked as one industry since the 1965 Auto Pact removed tariffs on vehicles and parts between the two countries [3]. Parts can cross the border several times before a finished vehicle comes off the line, so vehicles and parts are a large part of trade in both directions. In 2025 the US imported $45.8 billion of vehicles and parts from Canada, down from $50.8 billion in 2024 [4].
In 1990 machinery and transport equipment, which includes vehicles, was the largest category of US imports from Canada at $41.2 billion, or 44% of the categories on the Econovis chart. By late 2024 it had grown to $104.6 billion but its share had fallen to about a quarter, and fuels had taken the top spot (our arithmetic from the chart’s figures) [1].
Metals, wood and other materials
Canada supplies a lot of the raw and semi-finished materials US industry uses. The main ones in 2025 were plastics ($12.8 billion), gold and other precious metals ($11.6 billion), lumber and other wood products ($10.2 billion), aluminium ($9.7 billion), paper ($6.6 billion), iron and steel ($5.4 billion), copper ($3.9 billion) and fertilisers such as potash ($3.8 billion) [4]. Several of these fell in 2025, including aluminium (from $11.5 billion), steel (from $7.7 billion) and lumber (from $11.6 billion), after the US put tariffs on many Canadian goods from early 2025 [3][4].
Food and farm products
The US Trade Representative (USTR) says Canada sends the US over $40 billion a year in agricultural products, including baked goods, cereals and pasta, vegetable oils, beef, processed fruit and vegetables and fresh vegetables [2]. In the 2025 figures, the largest food groups were bakery and cereal products ($6.6 billion), meat ($4.2 billion), vegetable oils such as canola oil ($4.0 billion), fish and seafood ($3.7 billion) and vegetables ($3.2 billion) [4]. On the Econovis chart, food and beverages rose from $4.5 billion in 1990 to $37.6 billion in late 2024 [1].
How US imports from Canada have changed since 1990
US goods imports from Canada grew from $91.4 billion in 1990 to a peak of $437.4 billion in 2022, when energy prices were high, before easing to $411.8 billion in 2024 and $381.9 billion in 2025 [7].
| Year | US imports from Canada, billion US$ |
|---|---|
| 1990 | 91.4 |
| 2000 | 230.8 |
| 2008 | 339.5 |
| 2009 | 226.2 |
| 2014 | 349.3 |
| 2020 | 270.0 |
| 2022 | 437.4 |
| 2024 | 411.8 |
| 2025 | 381.9 |
Three changes stand out. Free trade (the 1989 Canada-US agreement, NAFTA from 1994 and the USMCA from July 2020) removed most tariffs and helped trade grow through the 1990s [2]. The 2008 financial crisis cut imports by a third in a single year. And energy has steadily taken a bigger share. In the first nine months of 2026, imports from Canada were $304.6 billion, about 5% higher than the same months of 2025 [7].
The Econovis graphic’s subtitle says fuels and crude materials account for nearly half of US imports from Canada. Its own figures don’t support that. Fuels ($133.7 billion) and crude materials ($19.6 billion) come to $153.3 billion of about $425 billion, or 36% (our arithmetic) [1]. Econovis’s own post gives 31.5% for fuels and 4.6% for crude materials [1].
Questions about what the US imports from Canada
What items are imported from Canada to the US?
Mainly crude oil and natural gas, cars and car parts, machinery, plastics, gold, lumber, aluminium, aircraft parts, paper, potash and food such as baked goods, meat, canola oil and seafood [4].
What is Canada’s biggest export to the USA?
Crude oil. Mineral fuels and oils were worth $119.0 billion of US imports from Canada in 2025, about 30% of the total, and most of that was crude [4][5]. Canada supplied 63% of all crude oil imported by the US that year [5].
How much does the US import from Canada each year?
$381.9 billion of goods in 2025, according to the US Census Bureau, down from $411.8 billion in 2024 [7]. The US also imported $64.5 billion of services from Canada in 2025 [2].
Does the US have a trade deficit with Canada?
Yes, in goods. US goods exports to Canada were $333.6 billion in 2025, so the goods deficit was $48.3 billion, down from $61.2 billion in 2024 [2][7]. Much of it is energy. The US runs a surplus with Canada in services, $27.7 billion in 2025 [2].
What does the US export to Canada?
Mostly machinery, vehicles and parts, electrical equipment, fuels and food. That side of the trade is covered in our article on US exports to Canada.
Sources
- Econovis, Fuels and Crude Materials Account for Nearly Half of U.S. Imports from Canada, the original post for this infographic (US Census data, 12 months to September 2024).
- Office of the United States Trade Representative, Canada, trade summary for 2025.
- Wikipedia, Canada and United States trade relations.
- UN Comtrade, US imports from Canada by HS chapter, 2024 and 2025 (as reported by the United States).
- US Energy Information Administration, US imports from Canada of crude oil and US imports of crude oil, annual.
- US Energy Information Administration, US natural gas imports from Canada and US natural gas imports, annual.
- US Census Bureau, Trade in Goods with Canada.
Last reviewed 10 November 2026