How big is the US trade deficit?
The US trade deficit in goods and services was $932.0 billion in 2025, according to the US Census Bureau and the Bureau of Economic Analysis. That was a $1,259.6 billion deficit in goods, partly offset by a $327.7 billion surplus in services. In the first nine months of 2026 the deficit was $662.3 billion, 12.2% lower than in the same months of 2025.
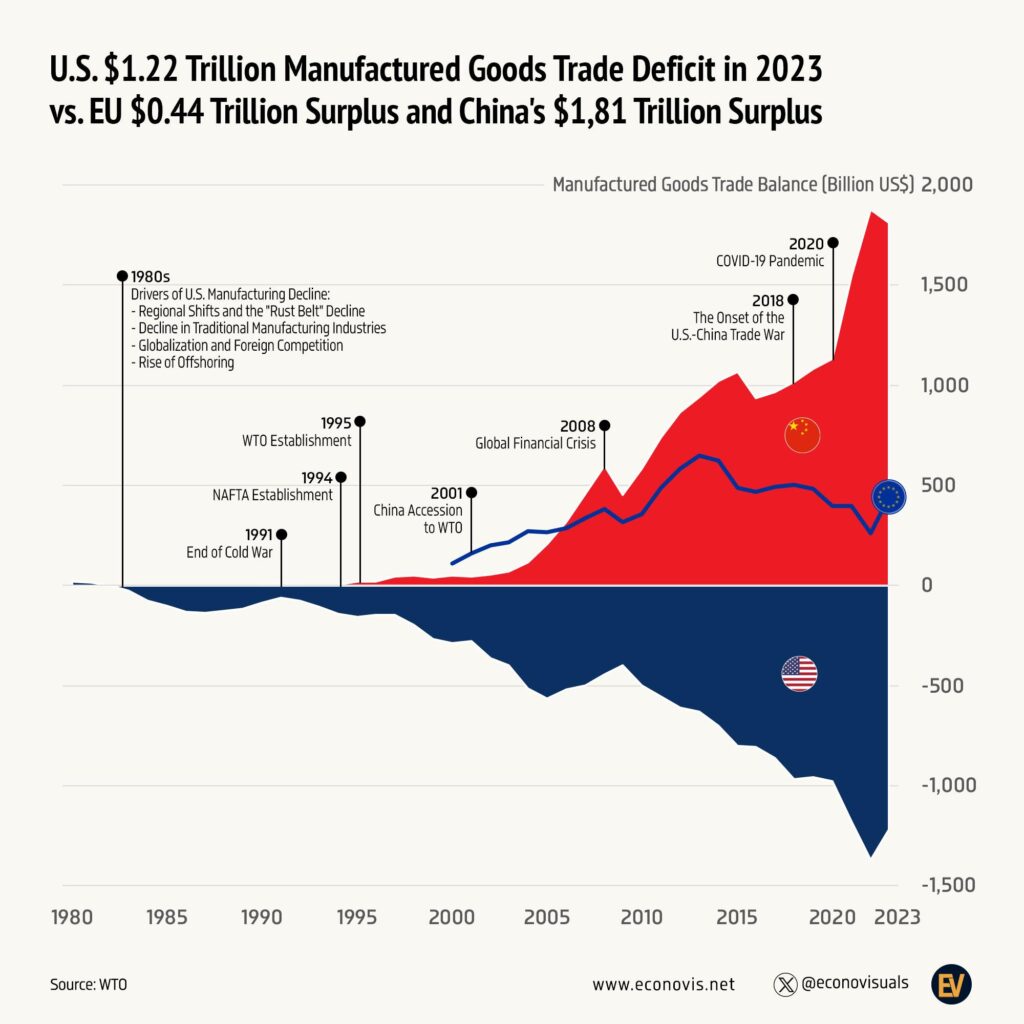
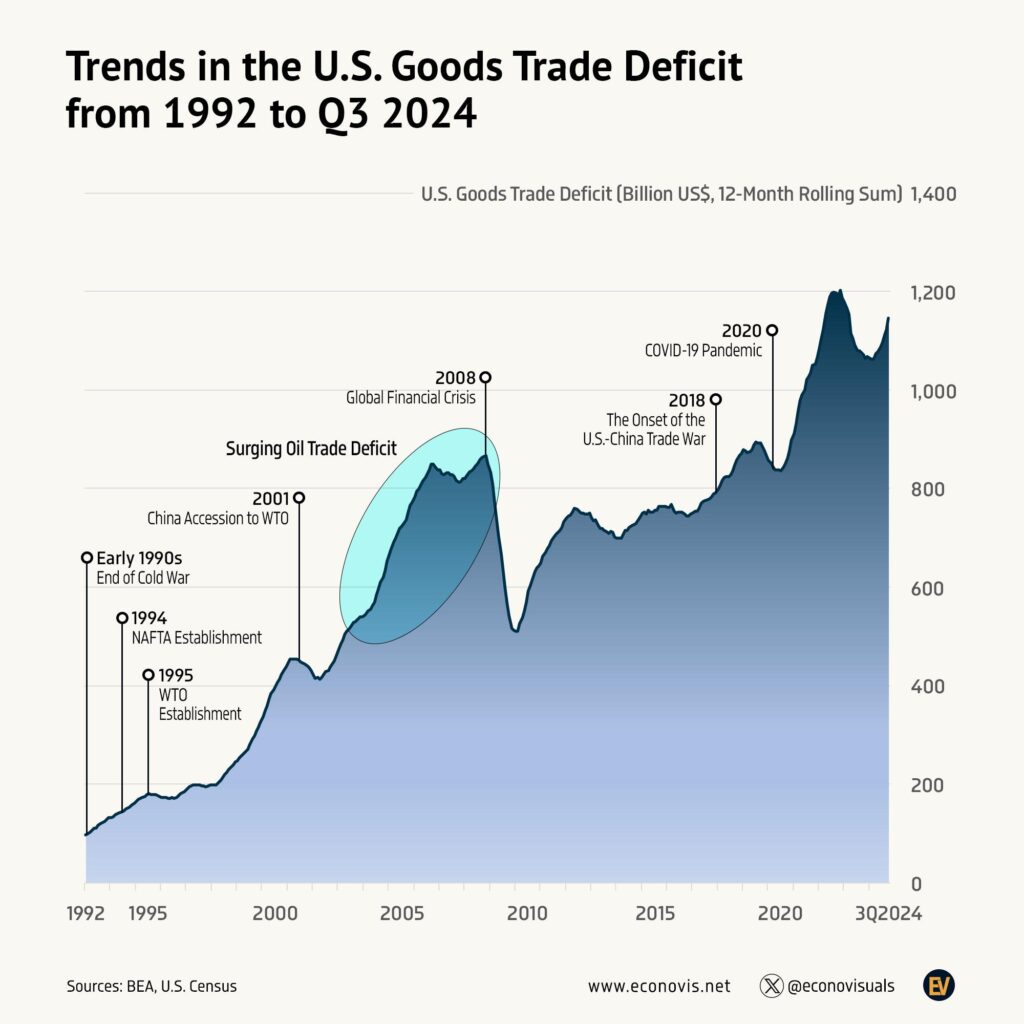
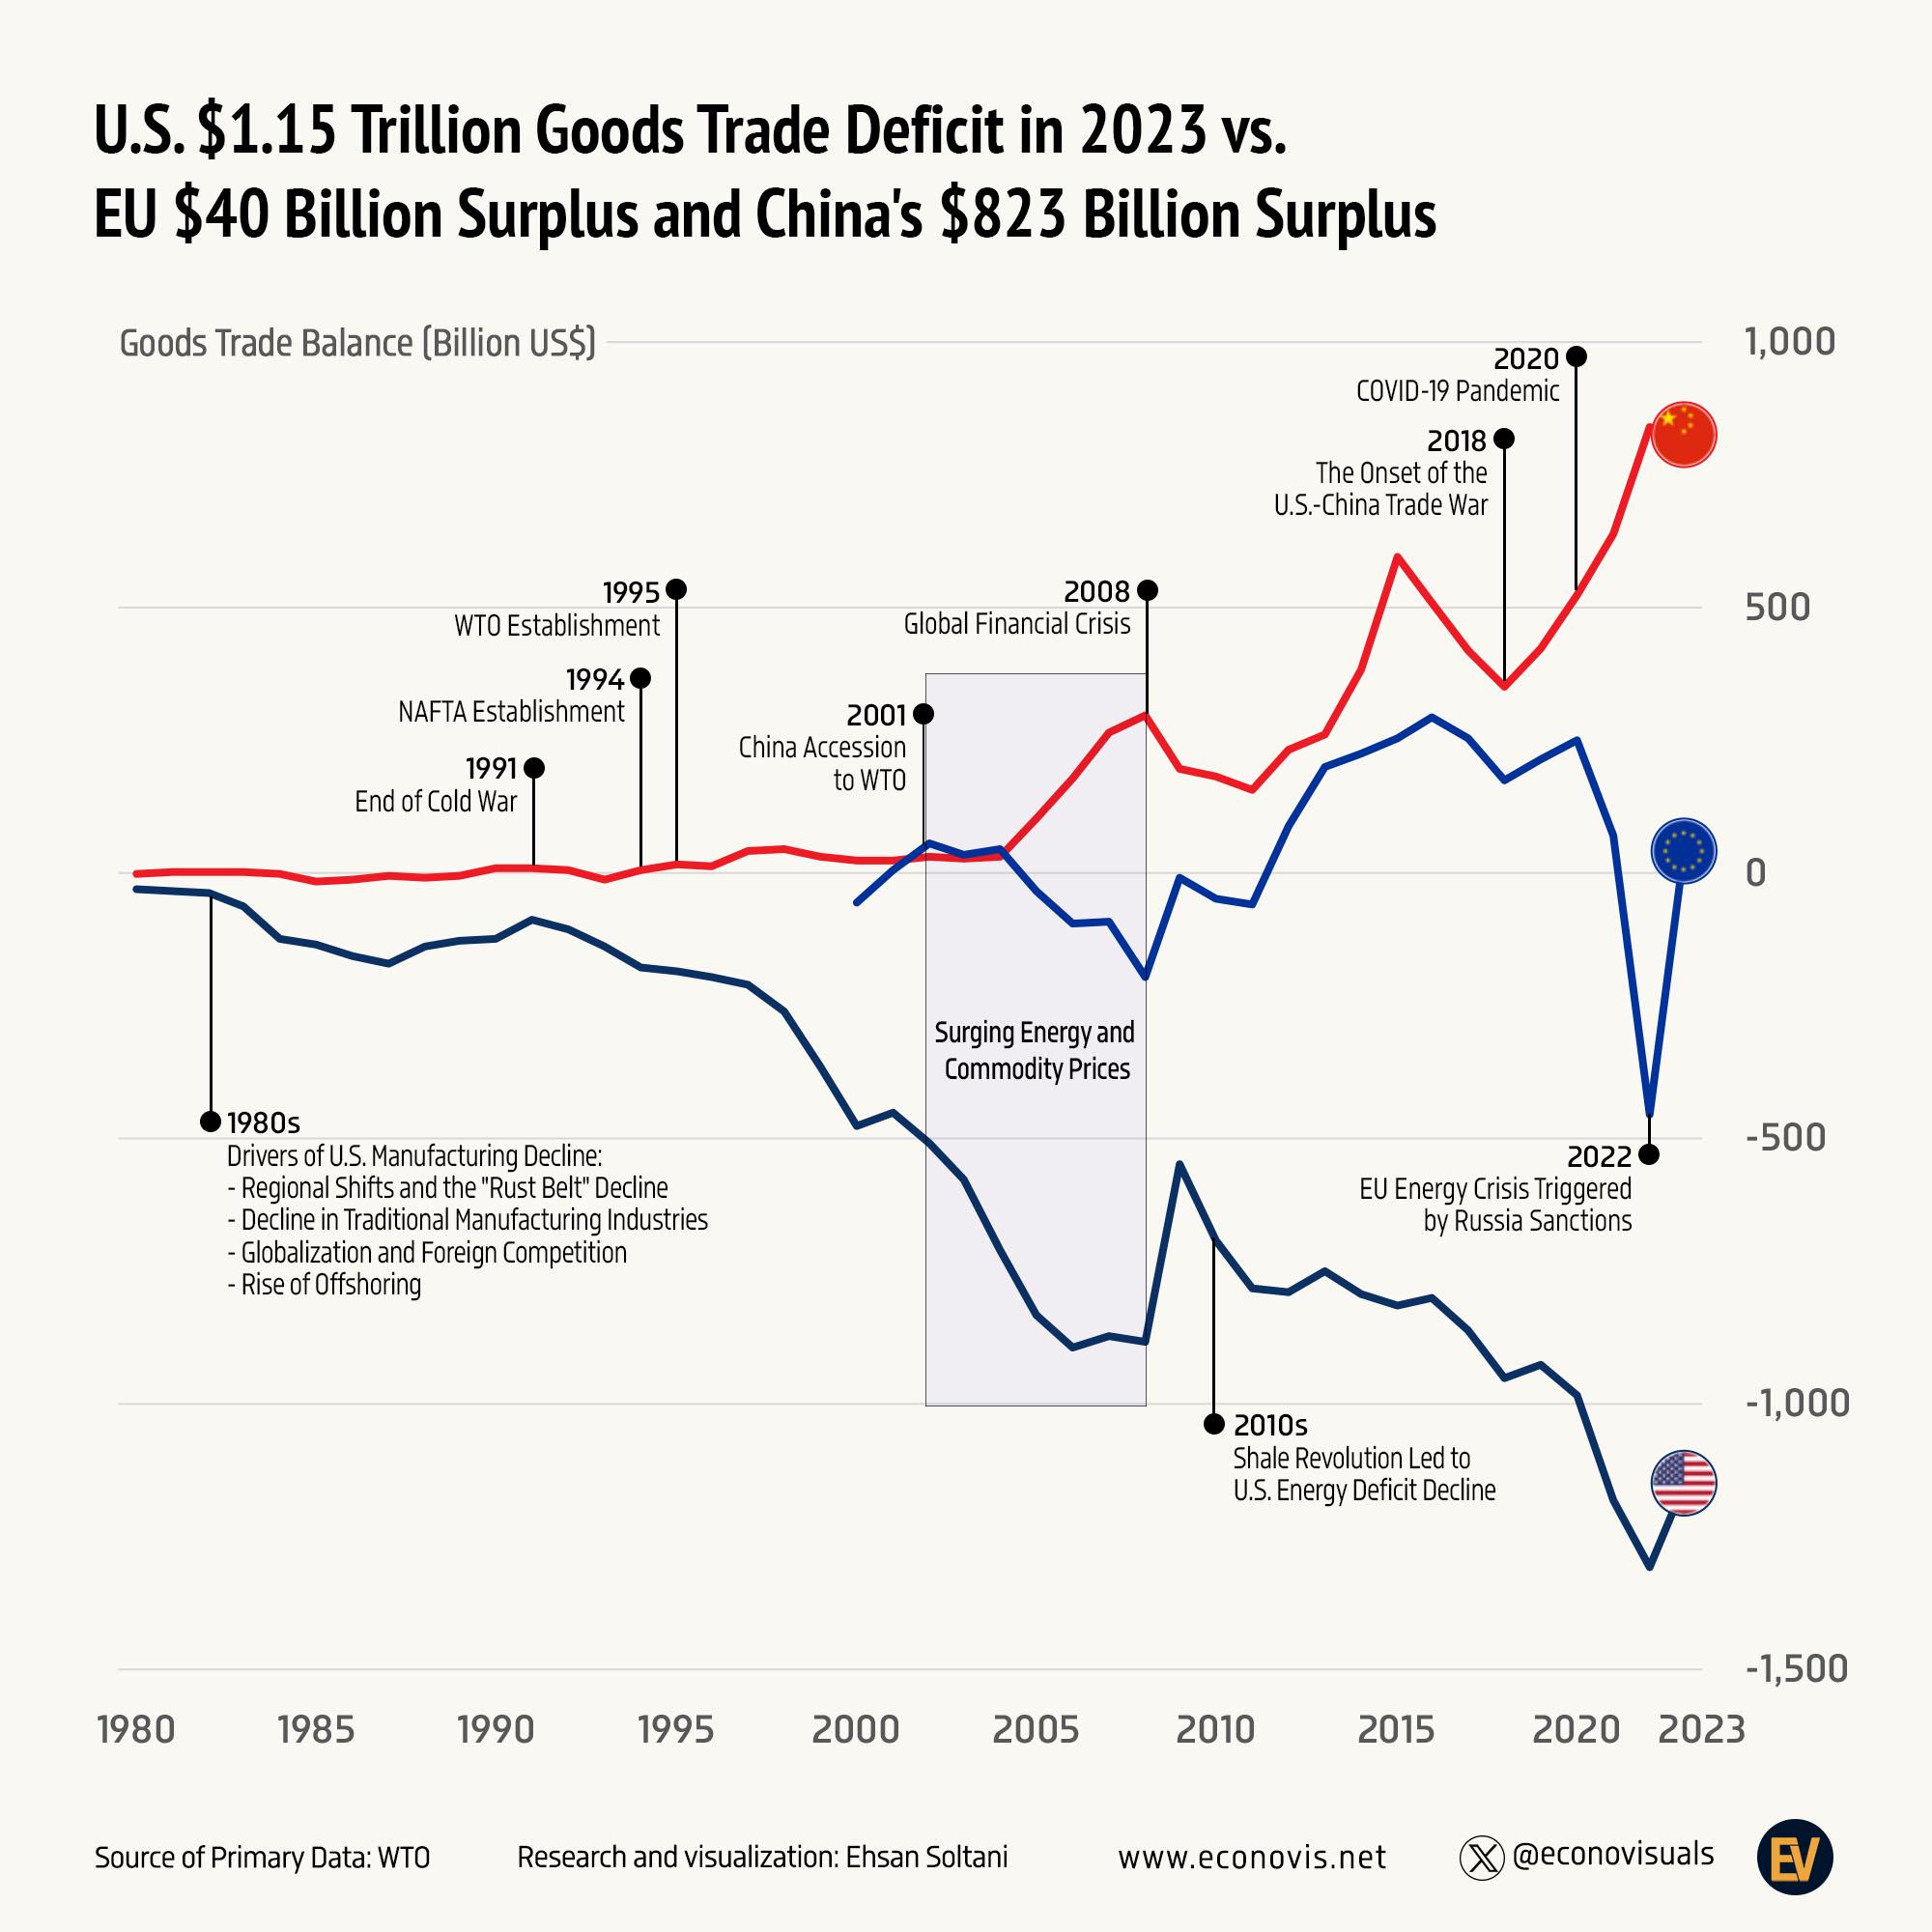
The United States has run a trade deficit every year since 1976. The gap grew fastest after the late 1990s, when imports from China and the rest of Asia took off, and it has stayed near or above $800 billion a year since 2021 [1][2]. The infographic by Econovis sets the US goods deficit against the trade balances of the European Union and China, the other two giants of world trade, from 1980 to 2023 [3].
What a trade deficit means
A trade deficit is the amount by which a country’s imports are bigger than its exports. The US buys more goods from the rest of the world than it sells, so it records a deficit in goods. It sells more services than it buys, things like travel, education, finance, software licences and business services, so it runs a surplus there [1]. The headline monthly figure that US news reports is the combined balance on goods and services.
The calculation is simple. Total exports minus total imports gives the balance, and a negative number is a deficit. In 2025 US exports were $3,429.8 billion and imports were $4,361.8 billion, a gap of $932.0 billion [1].
US trade deficit by year
The table shows the US balance on goods and services for selected years, in billions of dollars, on a balance of payments basis. Figures for 2024 onwards are from the latest monthly release, which includes the annual revisions published in June 2026. Earlier years are from the Census Bureau’s historical series [1][2].
| Year | Goods and services | Goods | Services |
|---|---|---|---|
| 1980 | -19.4 | -25.5 | +6.1 |
| 1990 | -80.9 | -111.0 | +30.2 |
| 2000 | -369.7 | -446.8 | +77.1 |
| 2006 | -763.5 | -837.3 | +73.8 |
| 2009 | -394.8 | -509.7 | +114.9 |
| 2015 | -490.8 | -761.9 | +271.1 |
| 2018 | -577.5 | -878.7 | +301.3 |
| 2020 | -646.0 | -912.9 | +266.8 |
| 2021 | -837.3 | -1,083.2 | +245.9 |
| 2022 | -923.7 | -1,174.6 | +250.8 |
| 2023 | -774.2 | -1,057.5 | +283.3 |
| 2024 | -885.5 | -1,212.8 | +327.3 |
| 2025 | -932.0 | -1,259.6 | +327.7 |
| 2026 (Jan to Sep) | -662.3 | -938.6 | +276.3 |
The last full year with a surplus was 1975, at $12.4 billion [2]. The deficit grew through the 1980s, narrowed in the early 1990s, then widened sharply from 1998. It fell by almost half in 2009, when the financial crisis cut US demand for imports, and climbed again from 2020. The 2022 and 2025 totals are the two largest on record [1][2].
The goods deficit and the services surplus
Almost all of the US trade deficit is in goods. On the Census basis, which counts goods as they cross the border, the goods deficit reached a record $1,234.6 billion in 2025, up from $1,054.6 billion in 2023 and $436.1 billion in 2000 [4]. The services surplus has grown too, from $77.1 billion in 2000 to $327.7 billion in 2025, but it only covers about a quarter of the goods gap (our arithmetic) [1][2].
The goods deficit is driven by consumer goods, cars and parts, computers and other capital goods that the US imports in larger amounts than it makes. Energy used to be a big part of it. The shale boom of the 2010s turned the US into a net exporter of oil and gas products, which Econovis notes cut the energy part of the deficit even as the overall deficit kept growing [3].
Why the US has a trade deficit
Economists usually explain the deficit through saving and investment rather than through trade deals alone. In the national accounts a trade deficit means the US is saving less than it invests, and the rest of the world fills the gap by investing in the US [5]. In practice the dollars Americans spend on imports flow back into US assets such as Treasury bonds, shares and property.
The Econovis timeline links the long rise in the deficit to several turning points. Manufacturing moved out of the old industrial areas of the Midwest and Northeast in the 1980s. The North American Free Trade Agreement took effect in 1994 and the World Trade Organization was set up in 1995. China joined the WTO in 2001, which Econovis says boosted its exports to the US [3]. The global financial crisis of 2008, the start of the US China trade war in 2018 and the COVID-19 pandemic in 2020 all moved the figures from one year to the next.
The US deficit against the EU and China
The Econovis chart uses World Trade Organization data, which counts imports including shipping and insurance costs, so its US figure is larger than the Census number. On that basis the US had a goods deficit of $1.15 trillion in 2023, while the EU had a surplus of $40 billion and China had a surplus of $823 billion [3]. World Bank figures from the same WTO source confirm China’s 2023 surplus at about $822 billion and the US deficit at about $1.15 trillion [6]. Eurostat puts the EU’s surplus with the rest of the world at €34.6 billion in 2023, after a record deficit of €432.0 billion in 2022, when energy import prices soared after Russia’s invasion of Ukraine [7].
The Econovis post calls the 2023 US deficit “historic”, but it was not the largest. On the same WTO basis the US deficit was $1.31 trillion in 2022, and the Census figures also show 2023 below 2022 [4][6]. Both China and the US have moved further apart since. In 2025 China’s goods surplus was about $1.19 trillion and the US deficit about $1.32 trillion on World Bank (WTO) figures, and the EU’s surplus was €113.9 billion [6][7].
Which countries the US has the biggest deficits with
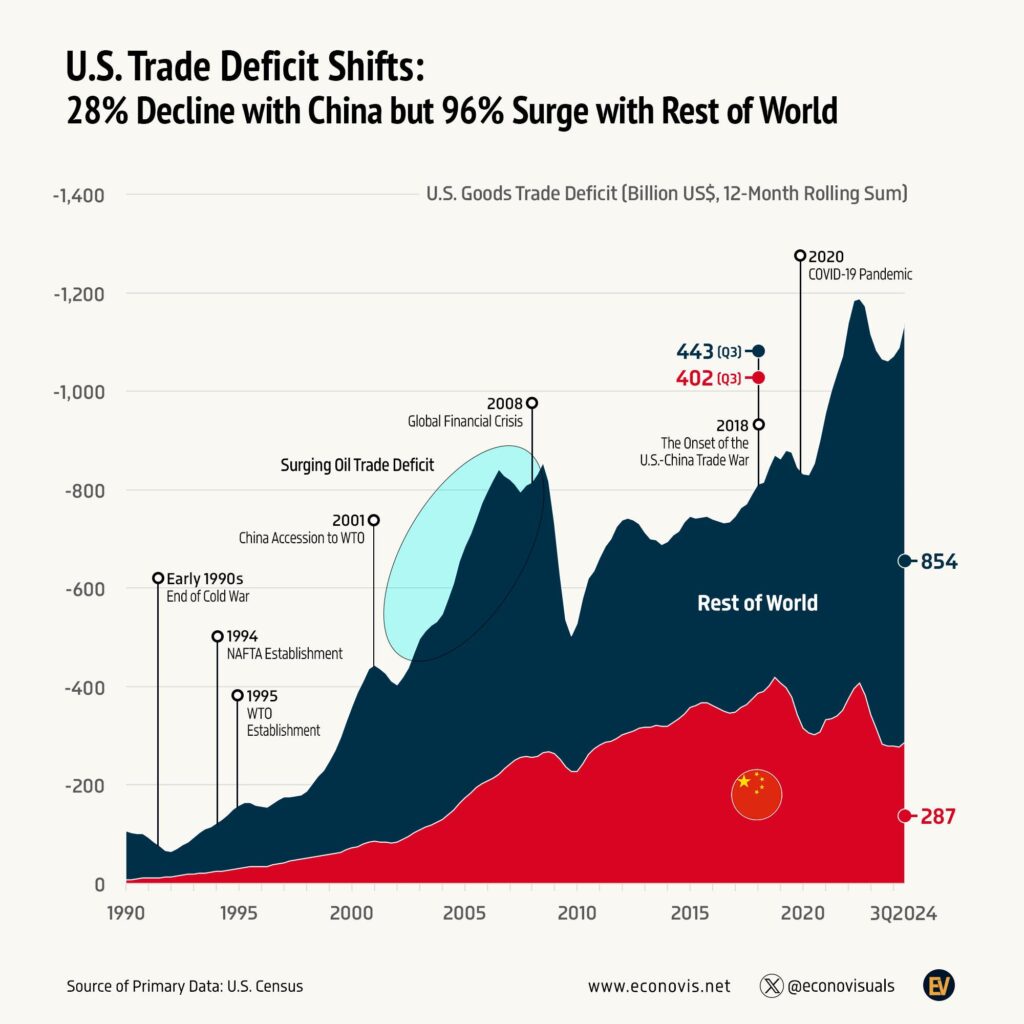
In the first nine months of 2026 the largest US goods deficits on a seasonally adjusted Census basis were with Vietnam ($188.7 billion), Mexico ($185.2 billion), Taiwan ($171.7 billion) and China ($131.2 billion). The deficit with the European Union as a whole was $80.1 billion, down from $189.2 billion in the same months of 2025 [1]. The US had its largest surpluses with the Netherlands and South and Central America.
The deficit with China has fallen a long way since its 2018 peak, but much of that trade has moved to other Asian suppliers rather than back to the US. There is more on that in our article on the US China trade deficit by year, and on Mexico in US Mexico trade.
Is a trade deficit bad?
Not on its own. The St. Louis Fed’s FRED blog makes the point that a deficit is not necessarily a sign of a poor economy. If demand is booming and local production can’t keep up, or foreigners are investing in the country, a deficit is not a problem in itself. The downside is that more of the future income from those investments will flow abroad [5]. The US deficit also tends to shrink when the economy is weak, as it did in 2009 when imports fell [2]. The wider worries are about what sits behind it, such as the loss of manufacturing jobs in some regions.
Questions about the US trade deficit
What is the US trade deficit in 2026?
$662.3 billion for January to September 2026, down 12.2% on the same months of 2025. The September figure alone was $105.0 billion [1].
What country does the US have the biggest trade deficit with?
In 2025 it was China among single countries, at $202.7 billion, with the EU larger as a bloc. In the first nine months of 2026 Vietnam was the largest, ahead of Mexico and Taiwan [1].
How is the trade deficit calculated?
Exports minus imports of goods and services. If imports are bigger the result is negative, which is a deficit. The Census Bureau and the Bureau of Economic Analysis publish the figures every month [1].
When did the US last have a trade surplus?
In 1975, when the US recorded a surplus of $12.4 billion on goods and services. There has been a deficit every year since 1976 [2].
Does the US have a trade surplus in services?
Yes. It was $327.7 billion in 2025, with travel, financial services and charges for the use of intellectual property among the biggest earners [1].
Sources
- US Census Bureau and Bureau of Economic Analysis, U.S. International Trade in Goods and Services, September 2026 (released 4 November 2026).
- US Census Bureau, U.S. Trade in Goods and Services, Balance of Payments Basis, 1960 through 2025.
- Econovis, U.S. $1.15 Trillion Trade Deficit vs. EU $40 Billion Trade Surplus and China $823 Billion Trade Surplus. The creator’s post with this chart, WTO data.
- US Census Bureau, Trade in Goods with World, Census Basis.
- FRED Blog, Federal Reserve Bank of St. Louis, Demystifying the trade balance.
- World Bank, Merchandise exports and imports (current US$), WTO data.
- Eurostat, EU trade since 2002 by SITC, extra-EU trade balance.
Last reviewed 11 November 2026