


Wealth and Income
US Household Income Distribution, Brackets and Percentiles
About 17% of the 137.1 million US households had $200,000 or more, 45% had at least $100,000, and the top fifth received 52% of all household income.
This section covers who earns and owns what, including household income, wealth by generation and region, poverty, billionaires, minimum and living wages. Most pages use census, central bank or survey data, and each one writes out the full figures and links to the source. Start with global wealth distribution by region, US social classes and income brackets, generational wealth distribution in the US, the poverty rate by state or US household income distribution. Figures are mostly American, with world comparisons for wealth, billionaires and minimum wages.
About 17% of the 137.1 million US households had $200,000 or more, 45% had at least $100,000, and the top fifth received 52% of all household income.

In 2025 the median household in Massachusetts had $118,500 a year, about twice the $57,840 in Mississippi, against a US median of $87,460.

This Visual Capitalist map shows the 2024 figures, when the range was $178K to $301K.

In 2025 the Census Bureau put Asian households at $126,300, non-Hispanic White households at $96,710, Hispanic households at $73,260 and Black households at…

Since 1989 the top 1% share has risen from 22.8%, and stocks have grown from 10% to 28% of what Americans own.
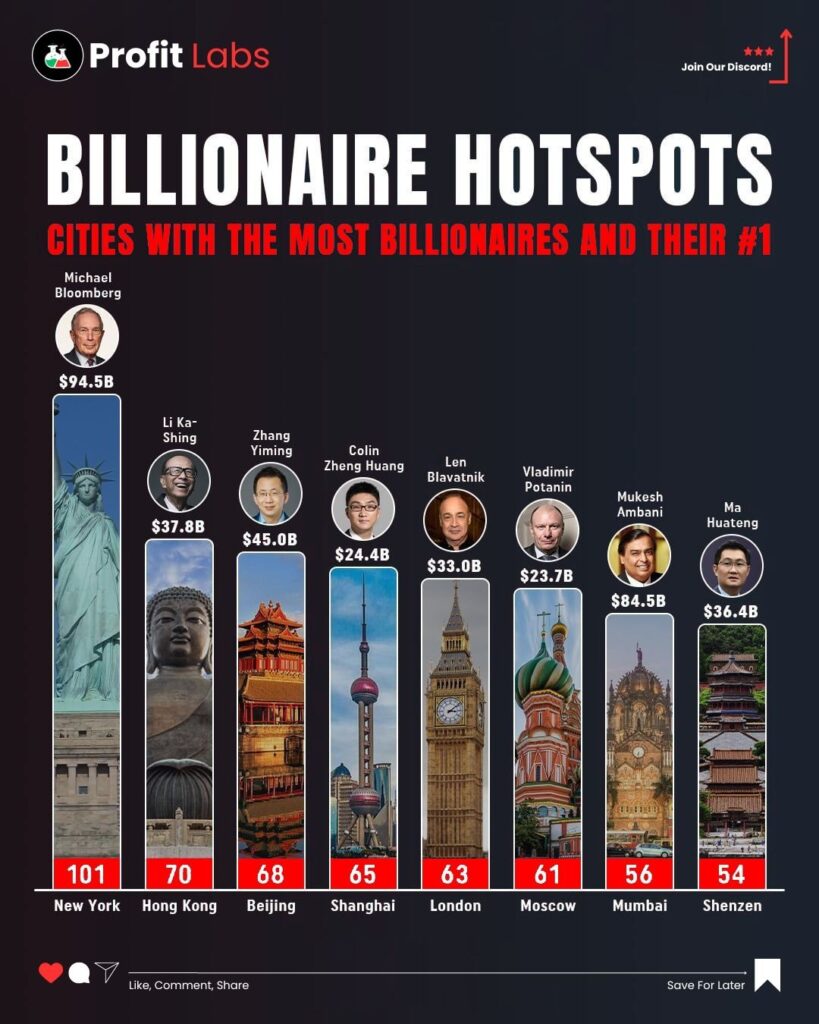
Forbes counted 123 billionaires living there in 2025, worth $759 billion together, and the Hurun Global Rich List 2026 counts 146.

West Virginia, New Mexico, Kentucky, Arkansas and Alabama are also above 15%.

In January 2023 a full-time minimum wage worker took home $2,140 a month in Luxembourg and $2,022 in Australia, against $95 in India and $68 in Nigeria,…
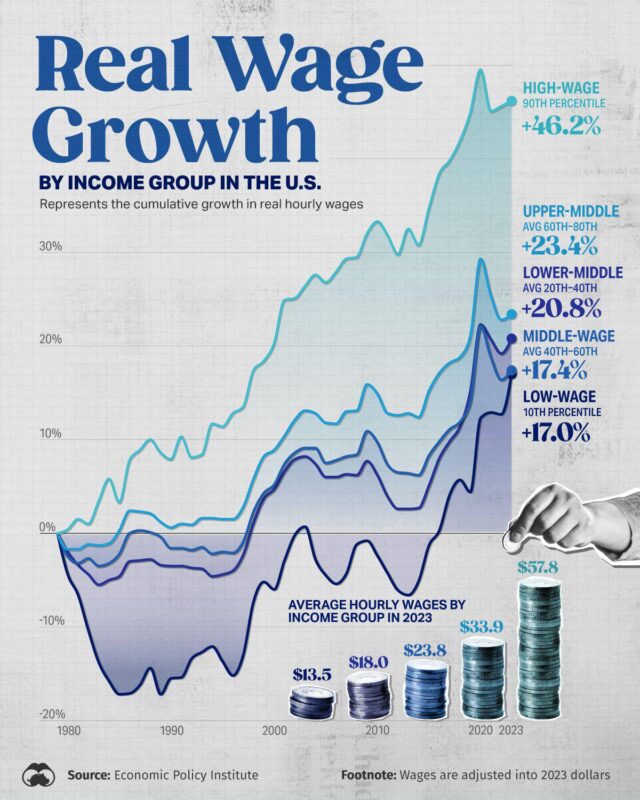
Over the long run every income group is better off than in 1979, but very unevenly.

The United States has by far the most, about 23.6 million or 41% of the total, followed by China, Japan, Germany and the UK.

On newer 2020 to 2024 census data, the lowest median income among large ZIP codes is 10454 in the South Bronx, at $24,086.
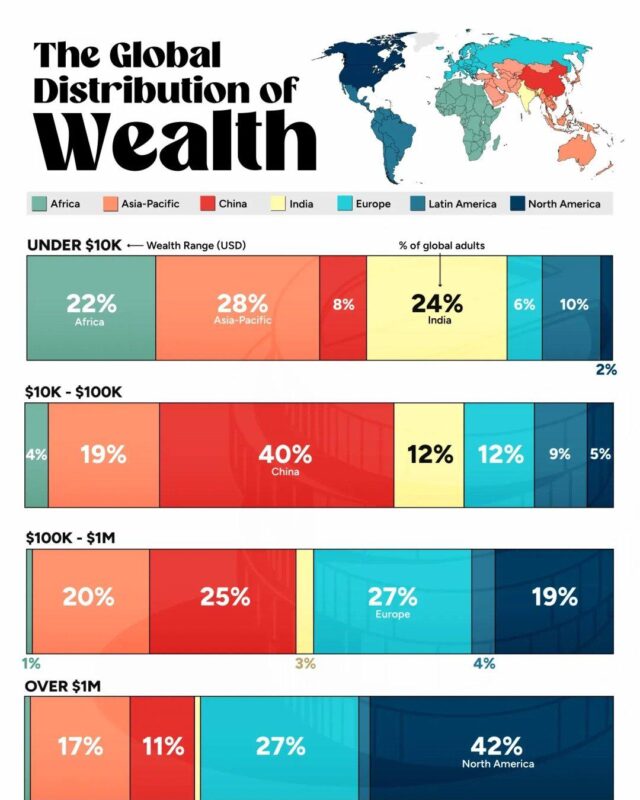
The 23 infographics here fall into four groups. Income charts cover US household income bands, median pay by age, sex, education and ethnic group, household income by state and the income needed to join the top 1%. Wage charts cover real wage growth since 1979, monthly minimum wages in 67 countries, living wages for a family of four and median monthly wages in Malaysia. Wealth charts show how US wealth splits by generation and by asset type, how adults in each wealth band are spread across world regions, and median against average wealth by country. The rest track poverty, from US states and ZIP codes to South Asia, and count billionaires, millionaires and the richest members of Congress.
For American incomes, begin with US Household Income Distribution 2023 in $5,000 Bands by u/TA-MajestyPalm. Median household income was $80,610, and 14.4% of households earn over $200,000. The same creator's US Median Income 2024 for Full-Time Workers, by Group puts the median for men at $67,704 and for women at $56,316. Real Wage Growth US Chart by Income Group Since 1979, from Voronoi by Visual Capitalist, shows high earners at the 90th percentile gaining 46.2% by 2023, against 17.0% for low-wage workers at the 10th percentile.
On wealth, the Visual Capitalist (Voronoi) chart Generational Wealth Distribution in the US, 1990 to 2023 shows Baby Boomers holding $76.2 trillion at the end of 2023, 52% of the country's net wealth. For a world comparison, Median Wealth by Country vs Average Wealth, Top 20 by Visual Capitalist uses UBS Global Wealth Report 2024 figures. Luxembourg leads on median wealth at $372,000 per adult, while the United States is fourth for average wealth but 14th for median.
For poverty, the Poverty Rate by State, Census Three-Year Average 2020 to 2022 map from Visual Capitalist (Voronoi) puts New Mexico highest at 18.2% and Utah and New Hampshire lowest at 7.1%, against a US total of 11.5%.
China had the most billionaires in 2024 with 814, just ahead of the USA with 800, according to the Voronoi by Visual Capitalist chart Countries With the Most Billionaires in 2024, which uses the Hurun Global Rich List. India is third with 271.
Nationally it takes an income of $787,712, according to Visual Capitalist's Top 1% Income Threshold US 2024 map of SmartAsset data. Connecticut needs the most at $1,152,254 and West Virginia the least at $420,453.
Senator Rick Scott is first at an estimated US$327 million on Carbon Finance's chart of the richest members of Congress, which uses Quiver Quantitative data as of 27 July 2024. Vern Buchanan (US$249 million) and Nancy Pelosi (US$248 million) follow.
Give it a permanent page where people looking for your subject find it, with your name and a link to your site. Content marketers, agencies, designers and researchers all list here.